Sea Ice Presence Forecasting
Pour la version française de cette page, cliquez sur le bouton ci-dessous.
The objective of this project is to develop a tool that can rapidly and accurately produce sea ice
presence forecasts for several Canadian bodies of water. The power of Artificial Intelligence
is leveraged to produce bitmaps of probabilities given historic and forecasted data.
Several Machine Learning
models are trained to recognize patterns and physical laws with 25 years of historical data. In
production, a given model requires limited information to produce a forecast. This process is
completely automated; forecasts are generated daily in the cloud and displayed on this website.
All products generated are available for download.
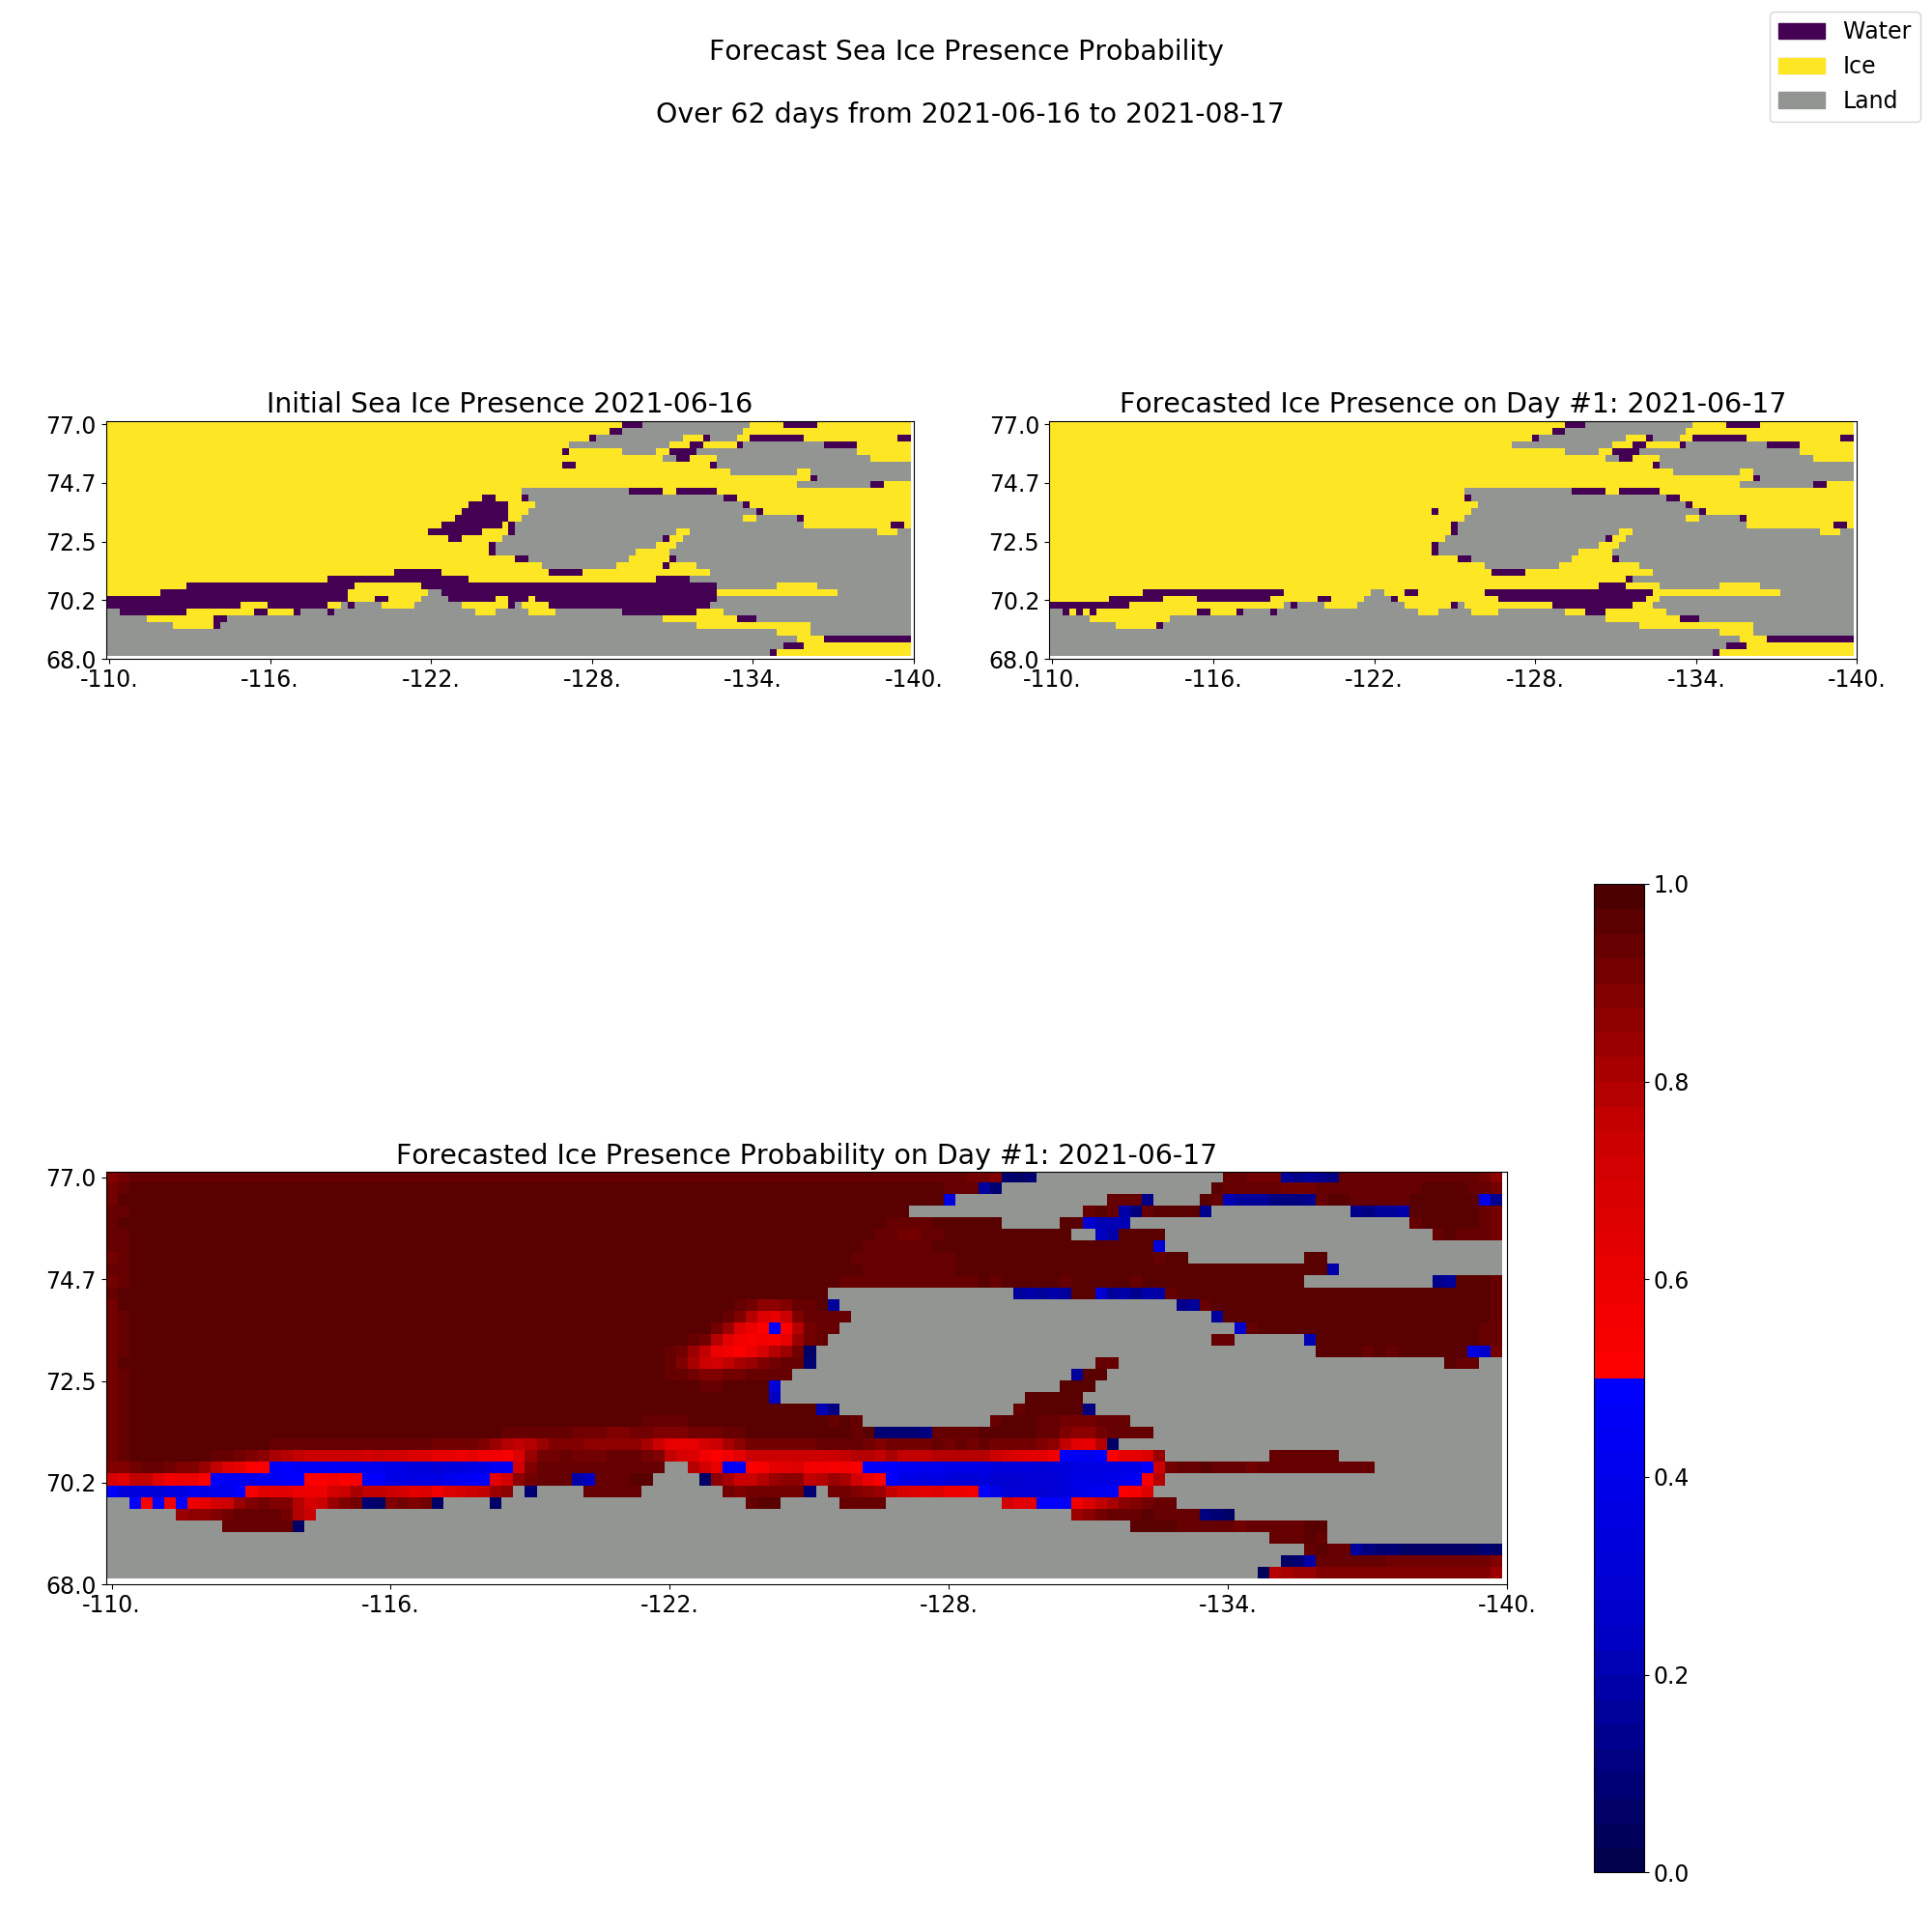
Map
On the map below, you can observe one through sixty day forecasts in GeoTIFF format. All GeoTIFF files are geo-referenced for your convenience. You can click on the map to find the probability of ice presence at a desired latitude and longitude coordinate.
Latest Upload:Forecasted For:
Products
Ice Presence Forecasts
Below is a gif file animating the forecasted movement of ice at the East Coast for the next 62 days.
Latest Upload:
Forecasted For:
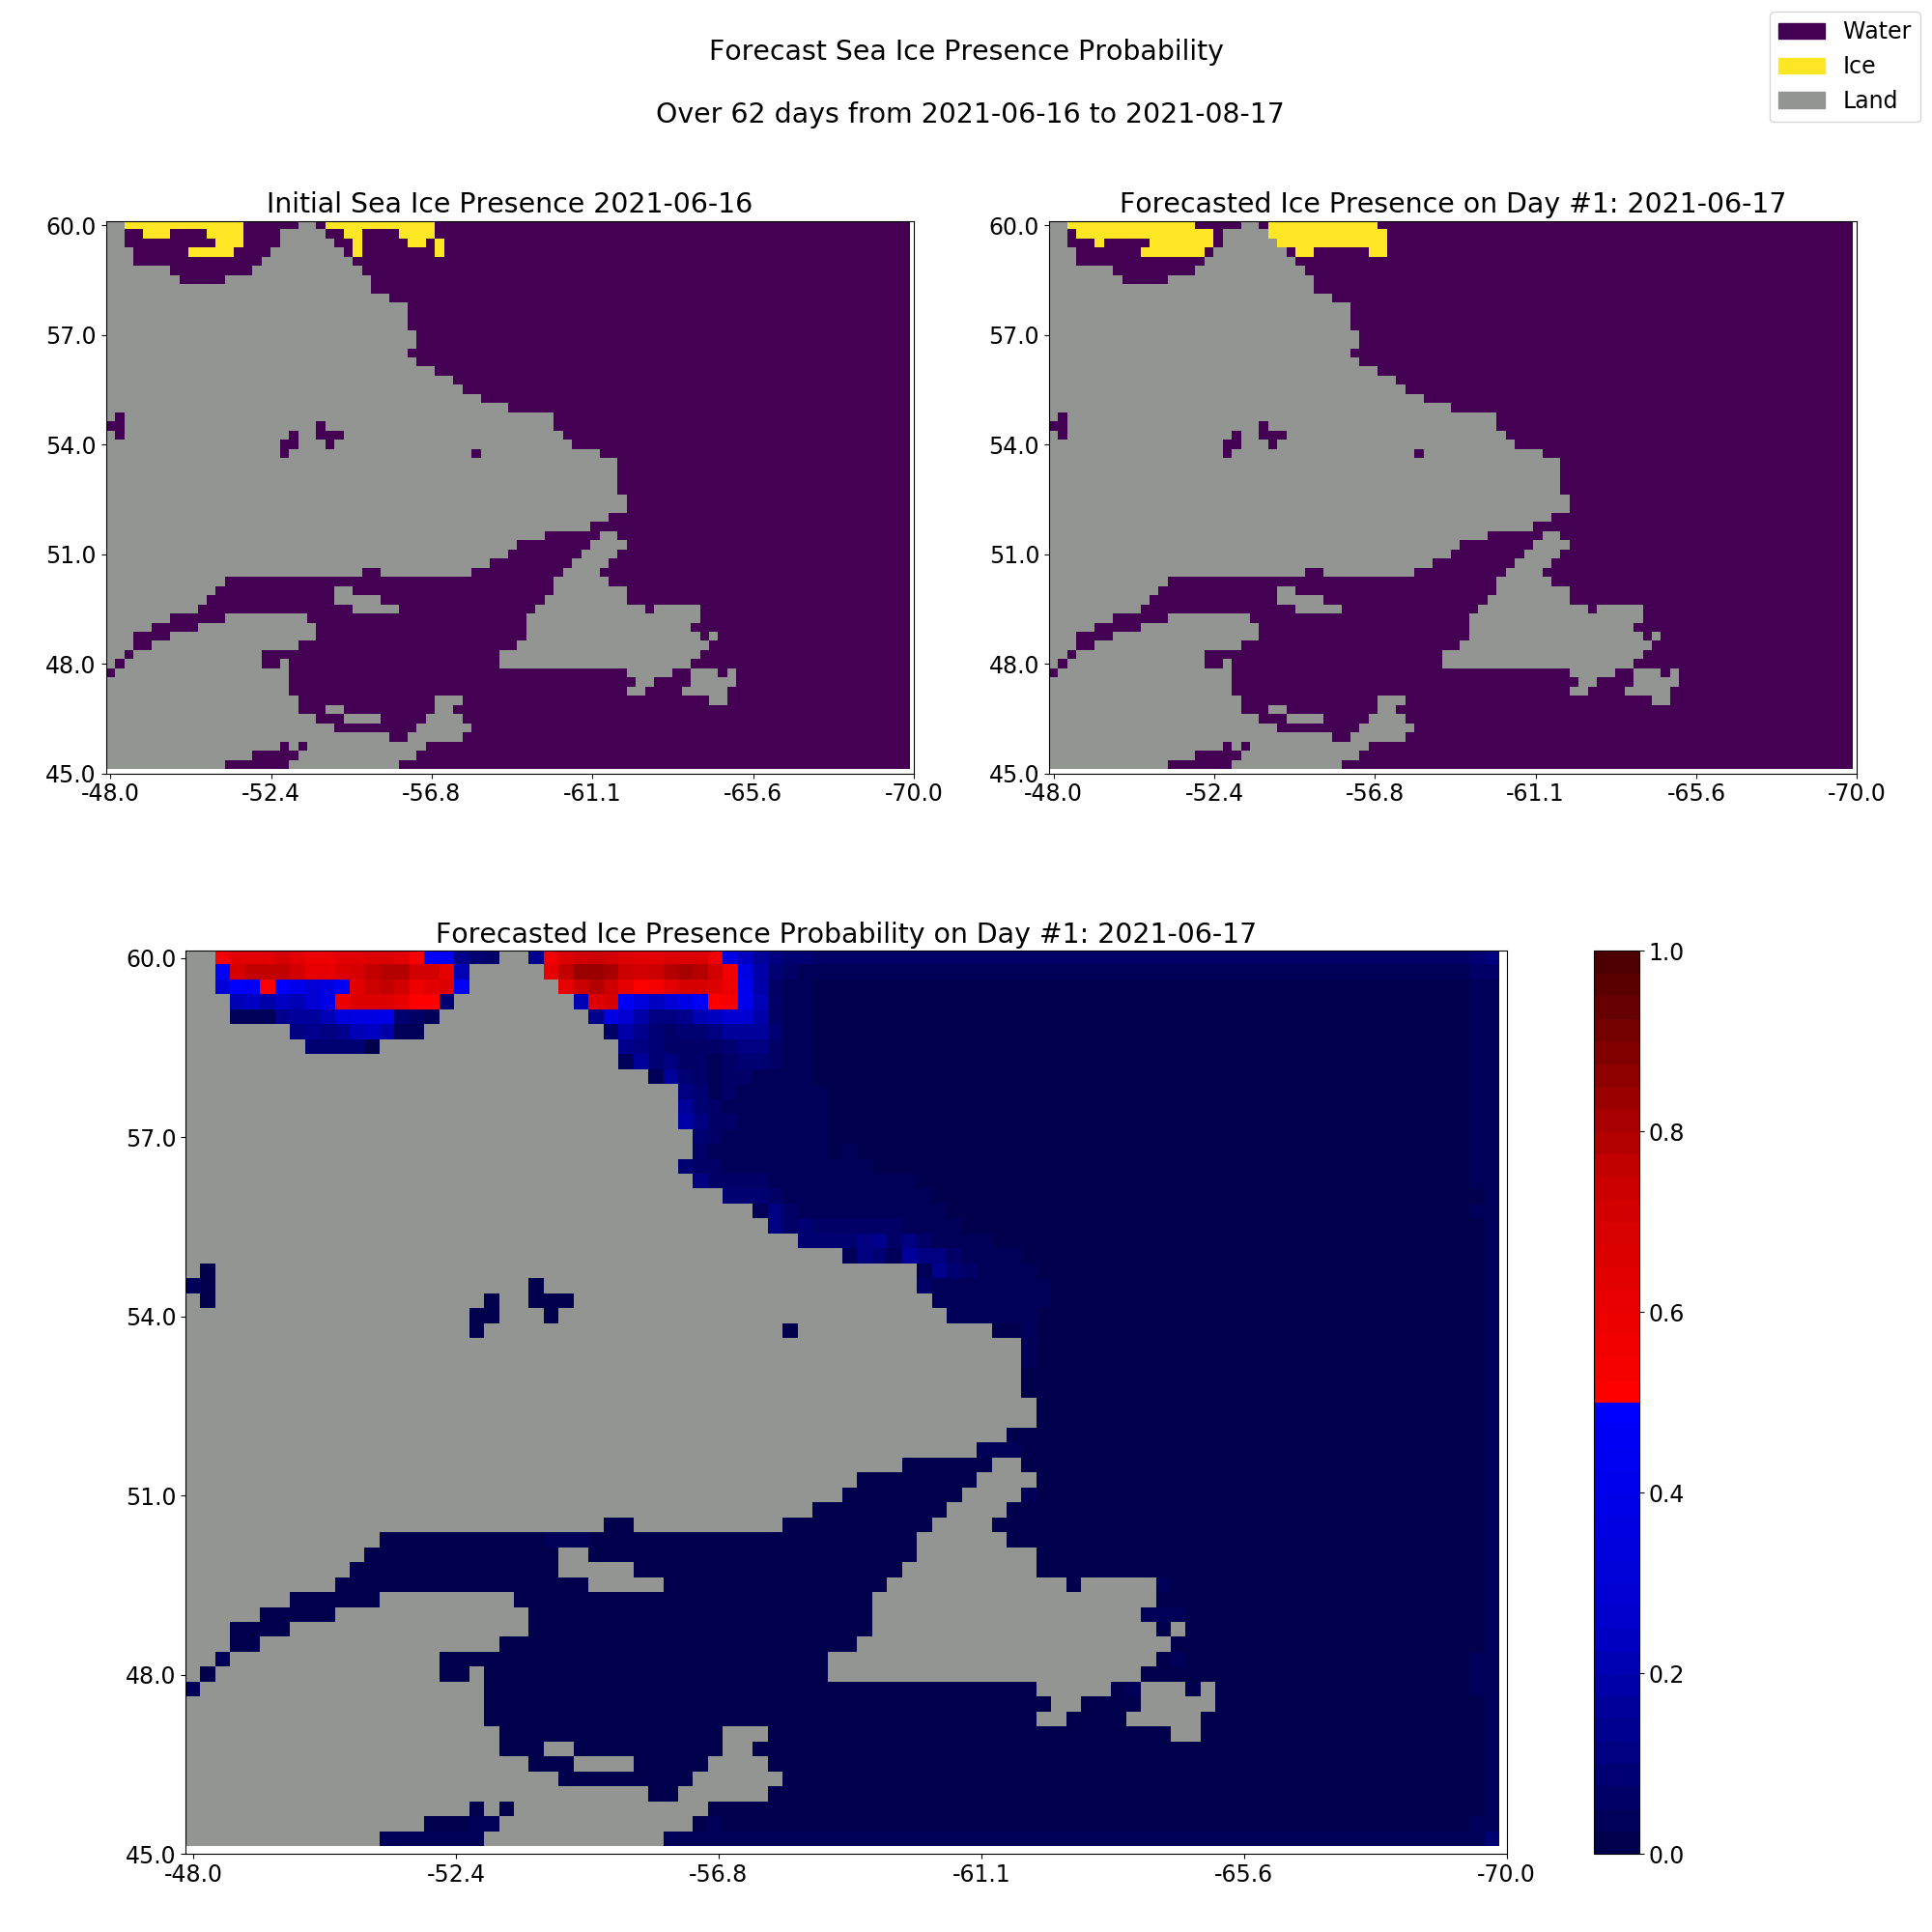
All products, including PNG's and GeoTIFF's are available for download via the button below.
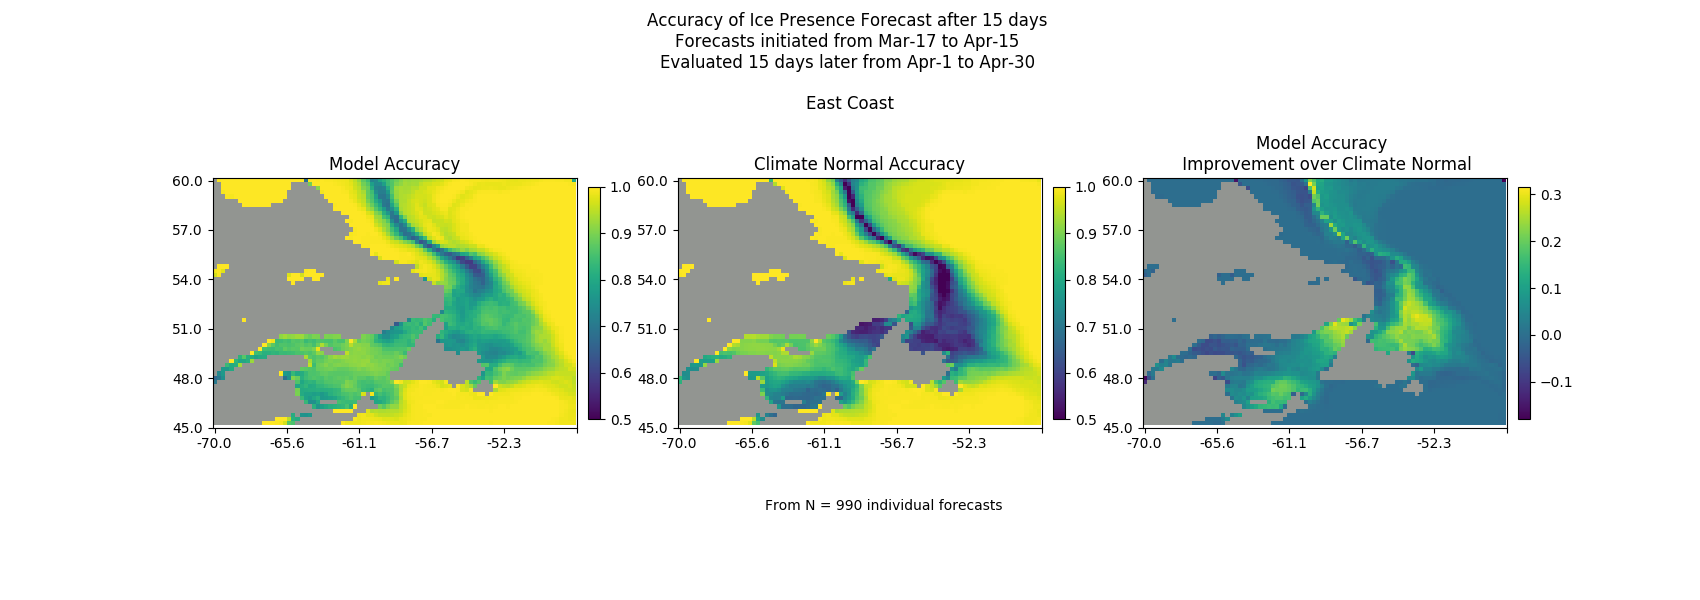
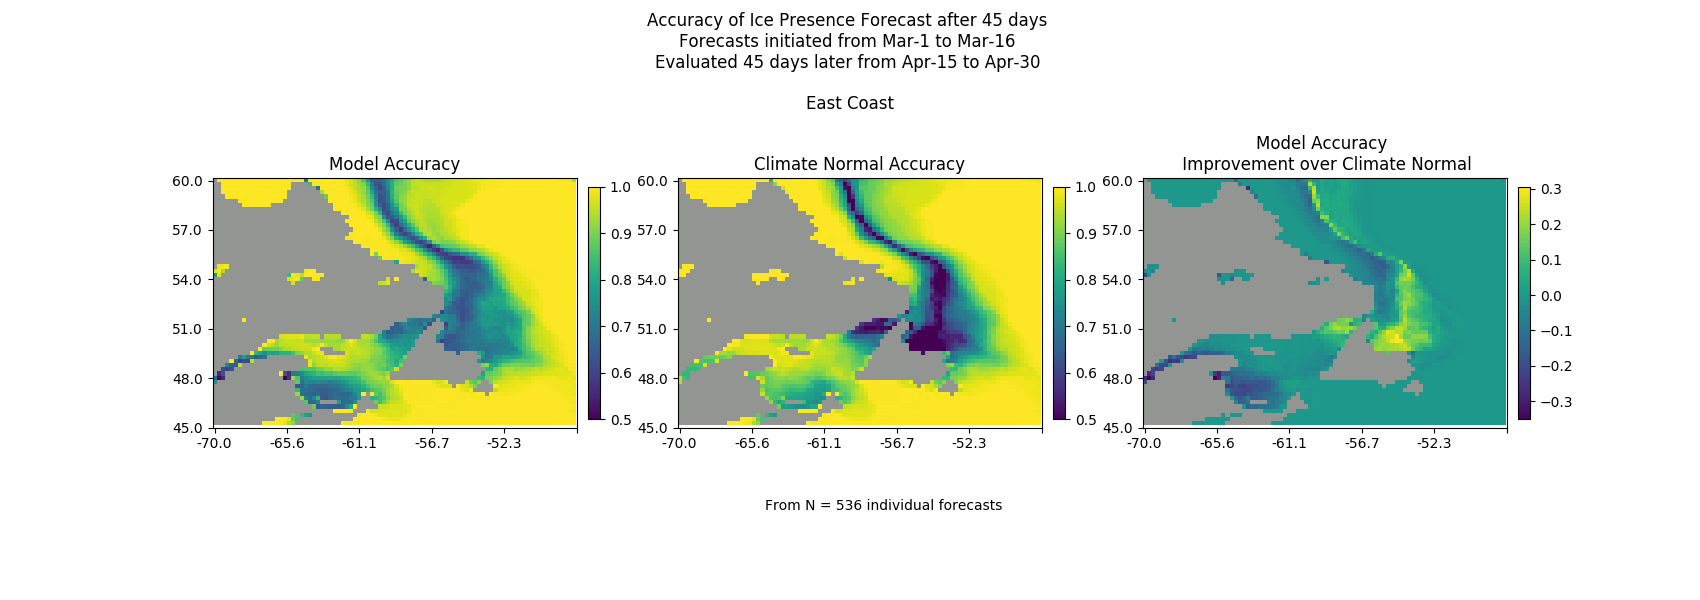
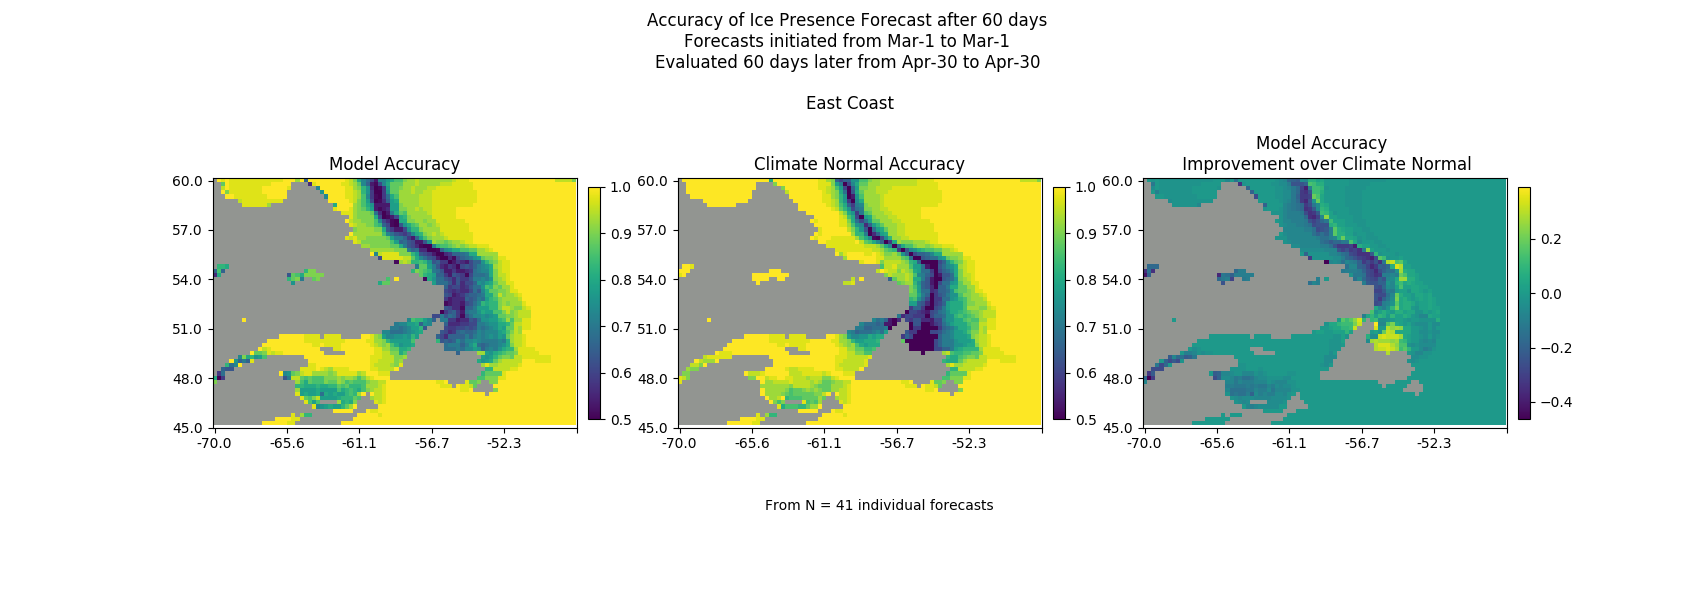
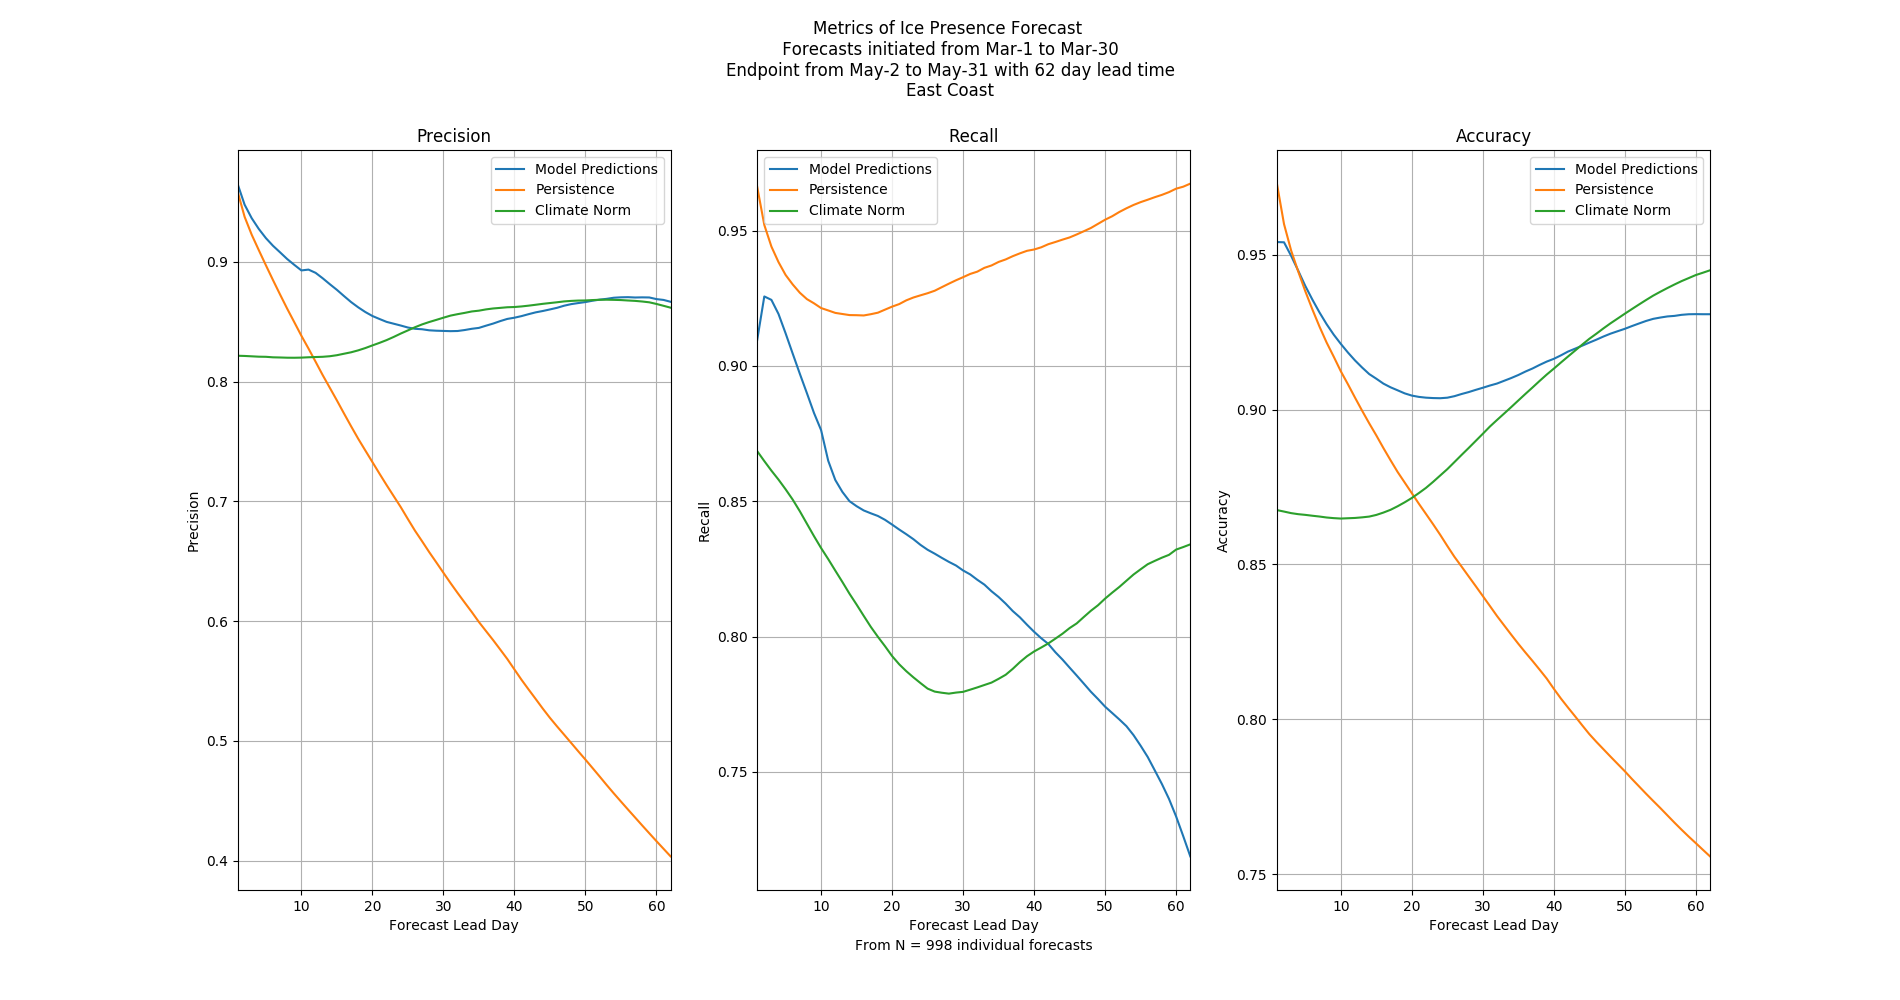
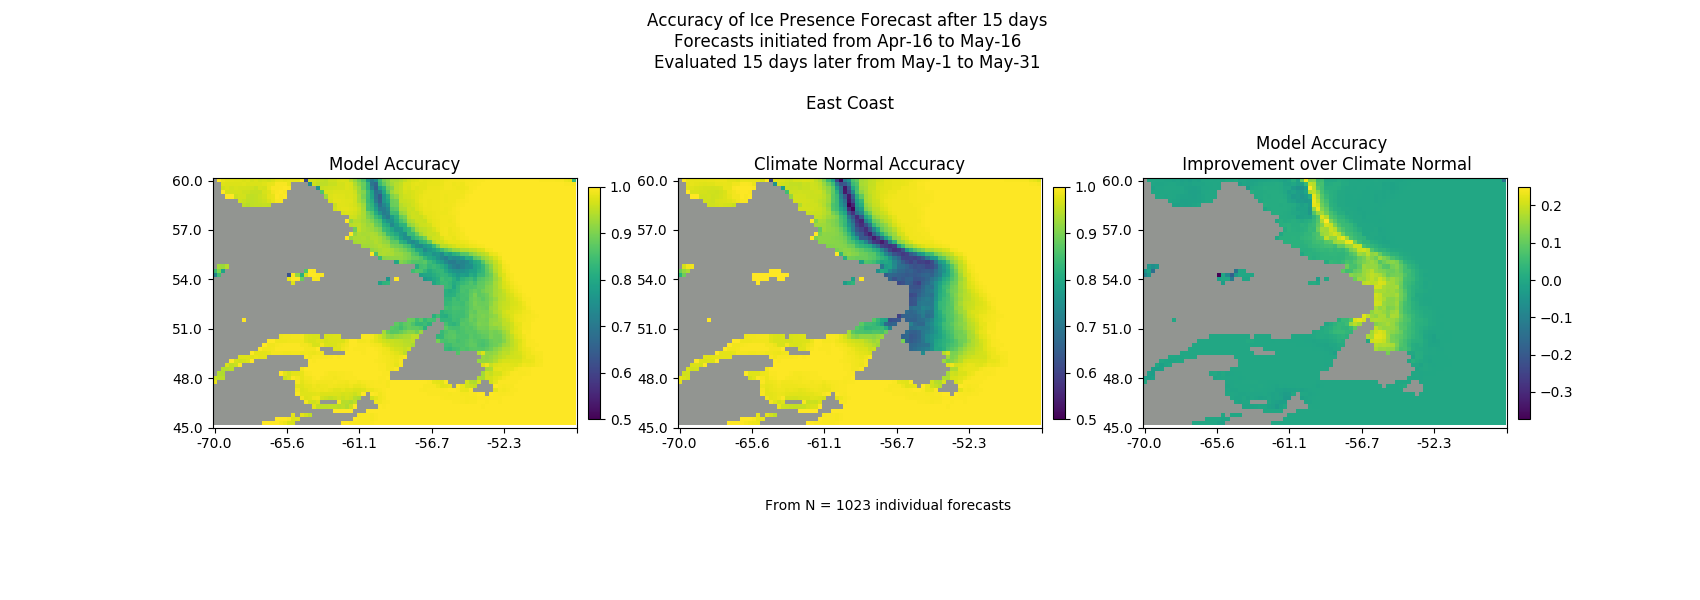
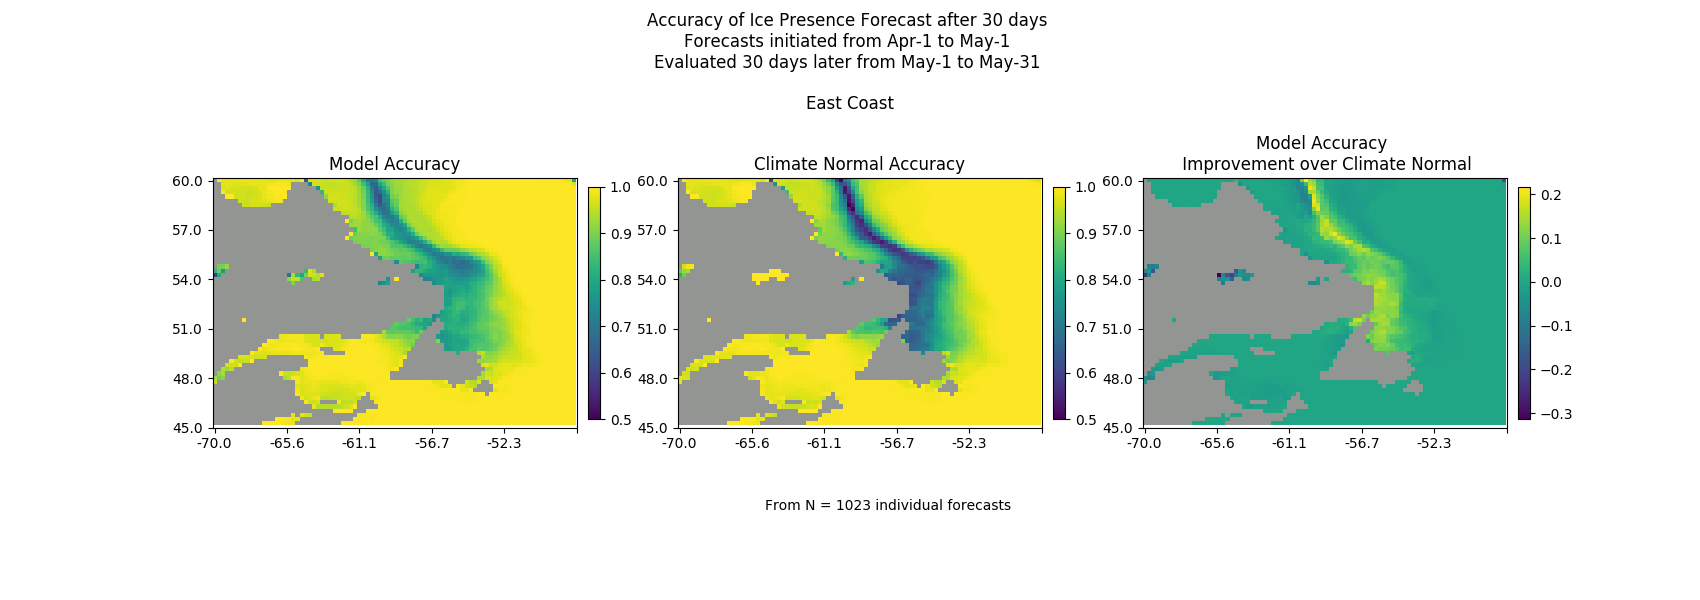
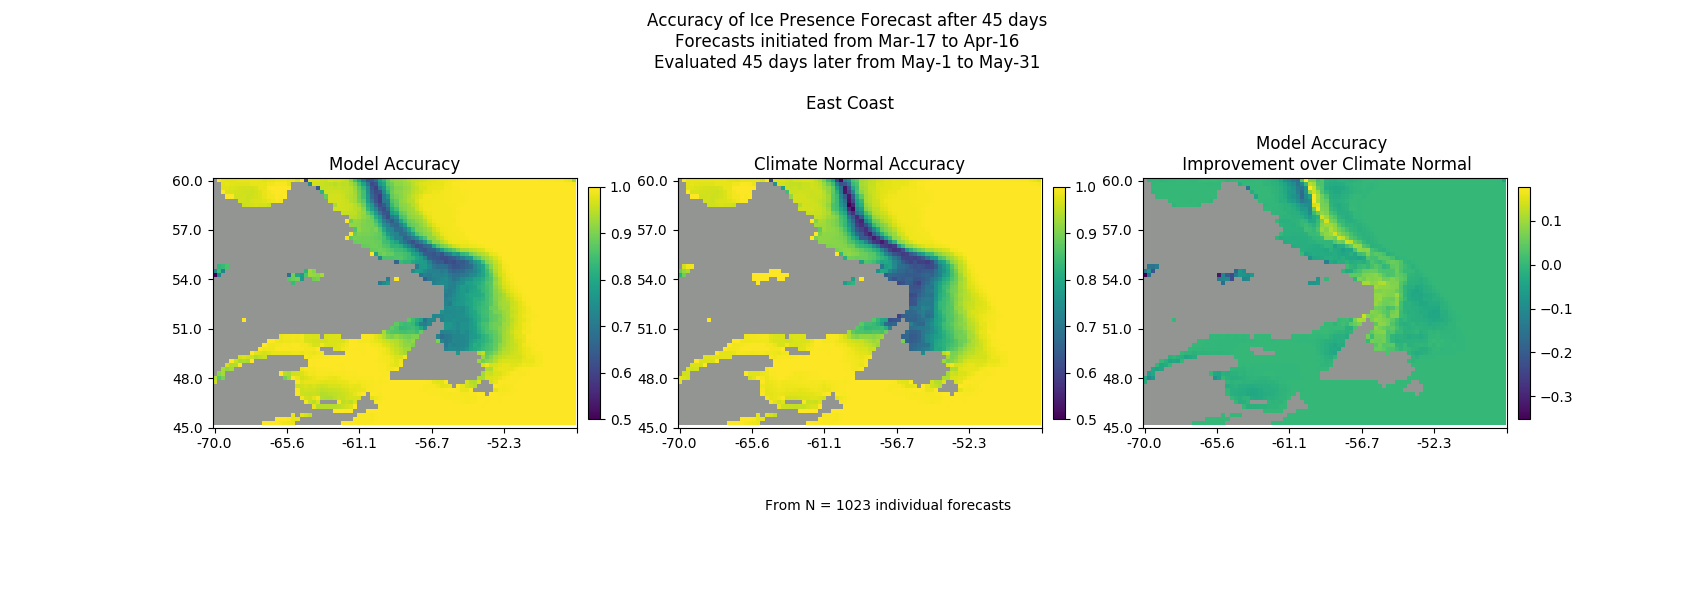
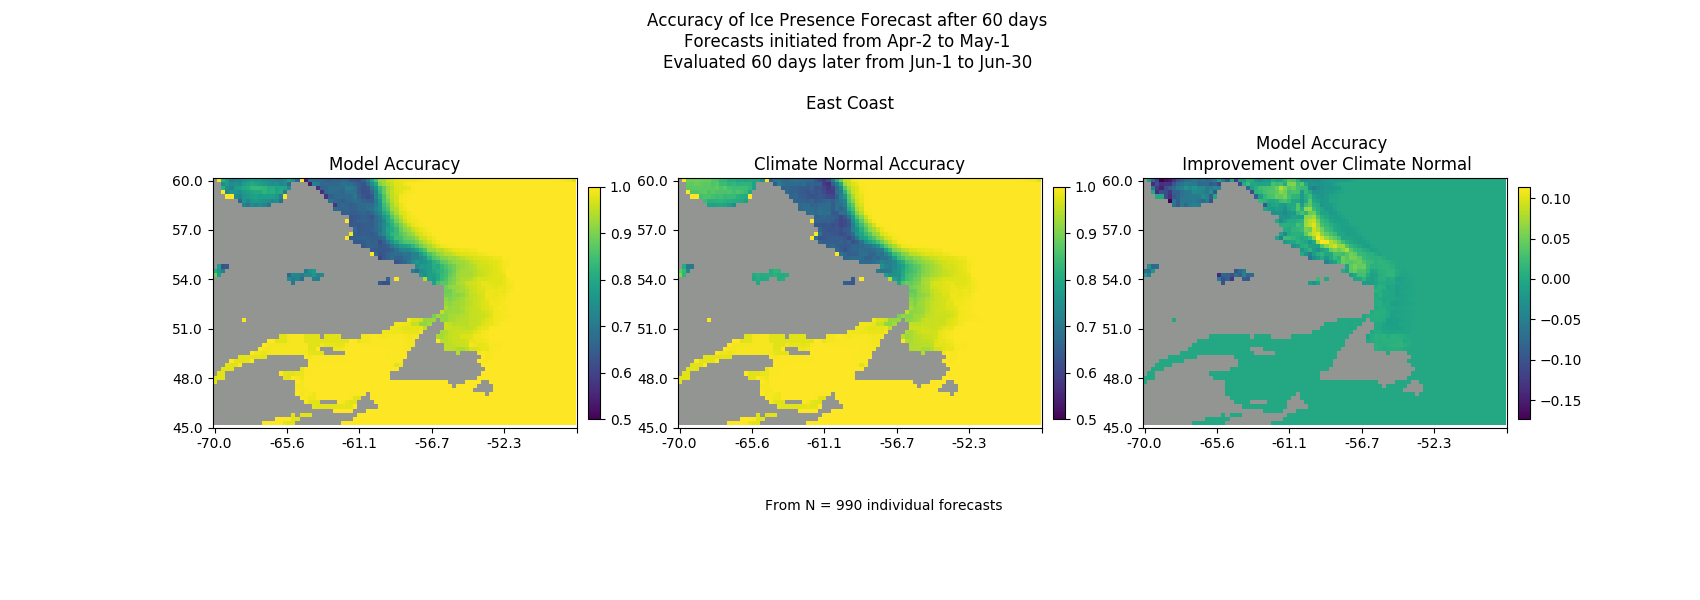
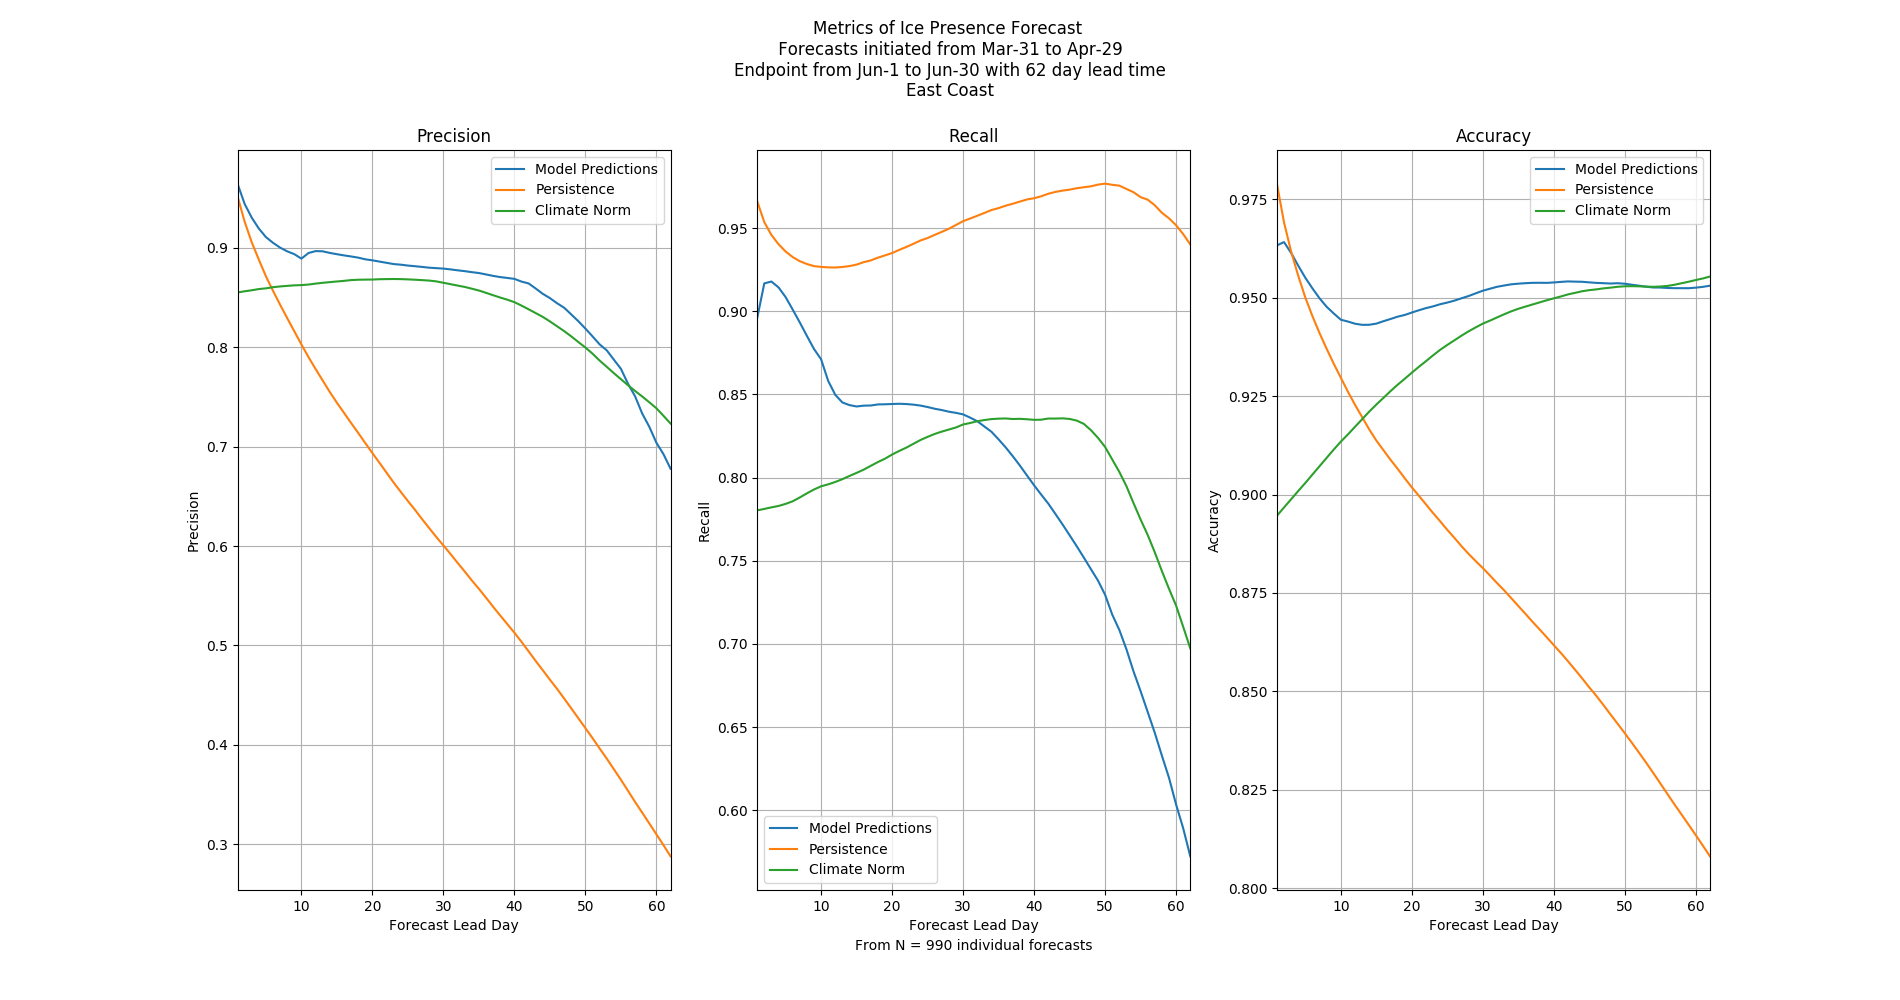
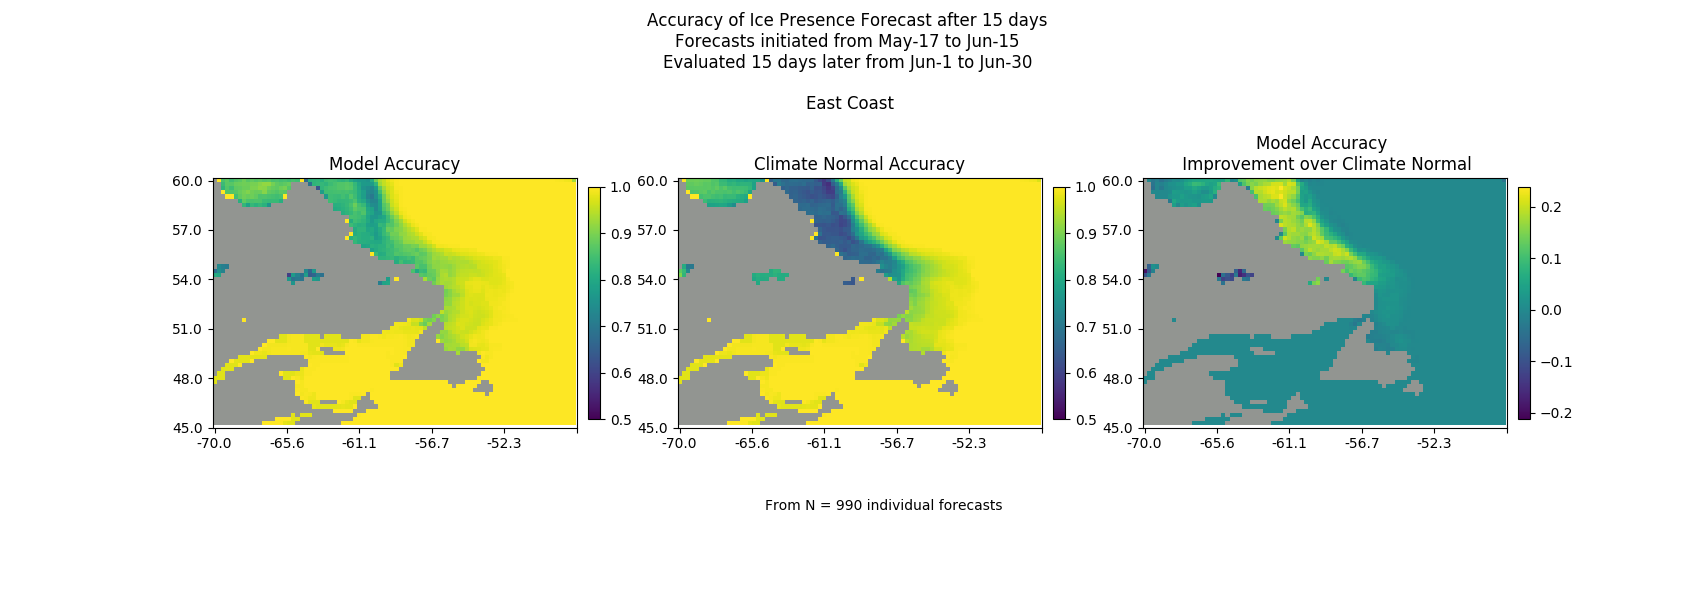
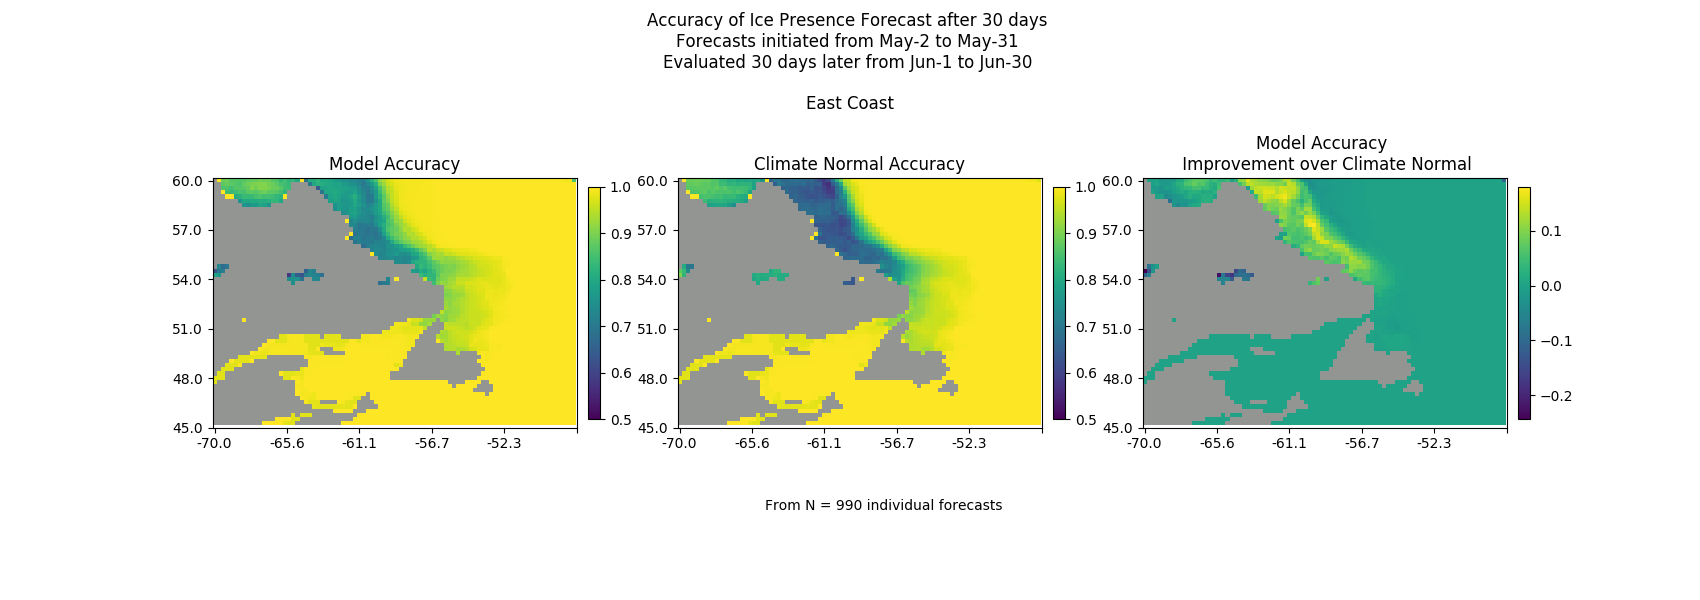
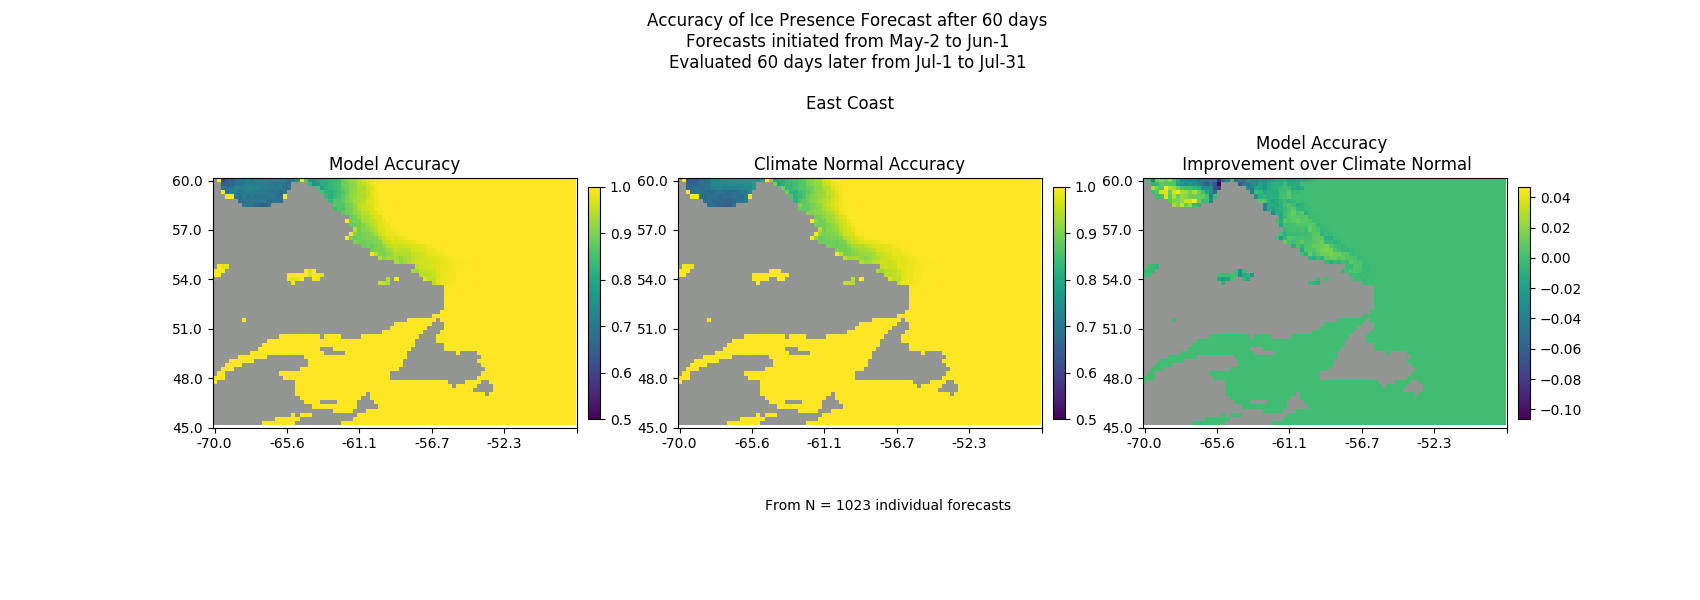
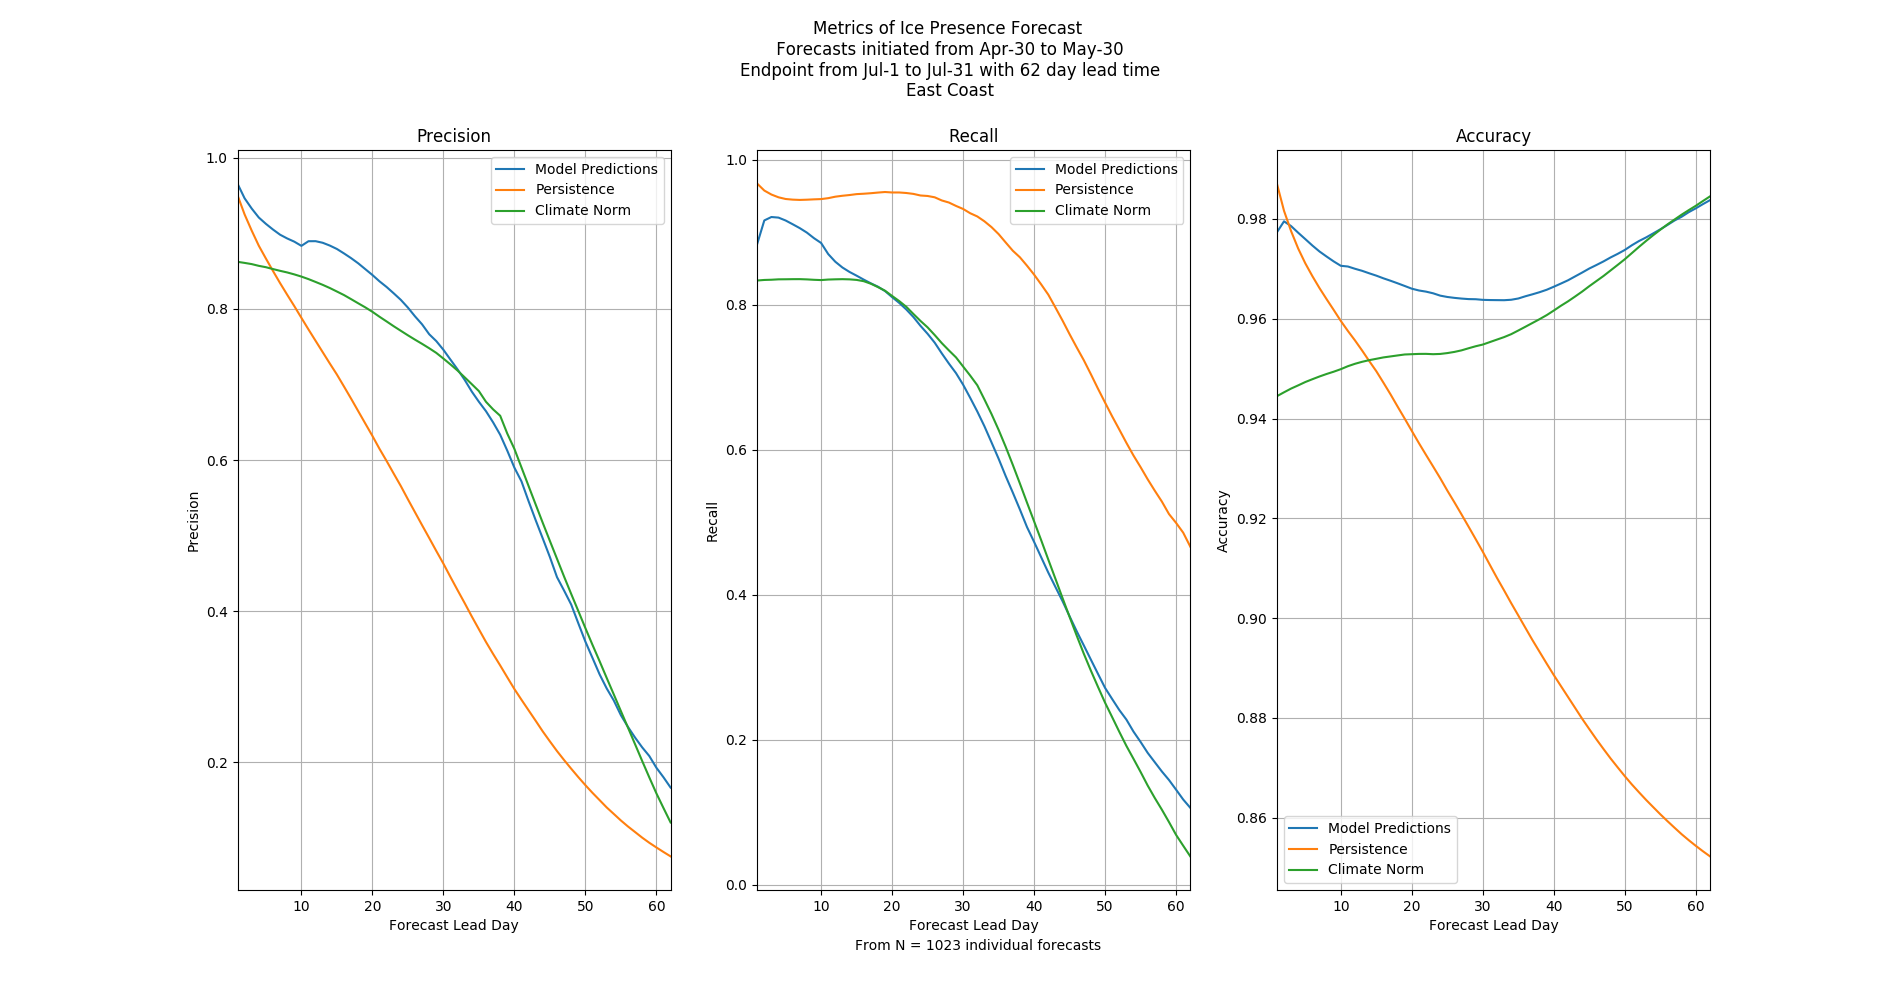
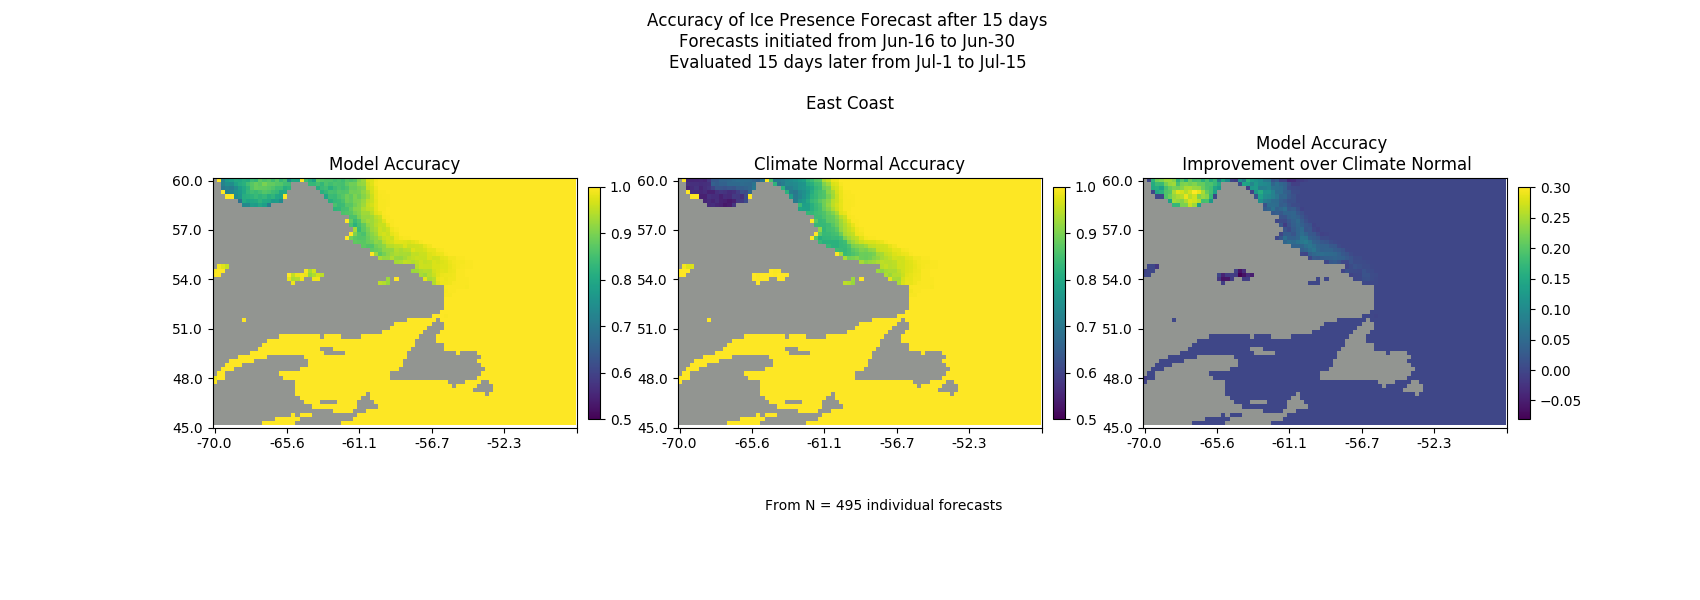
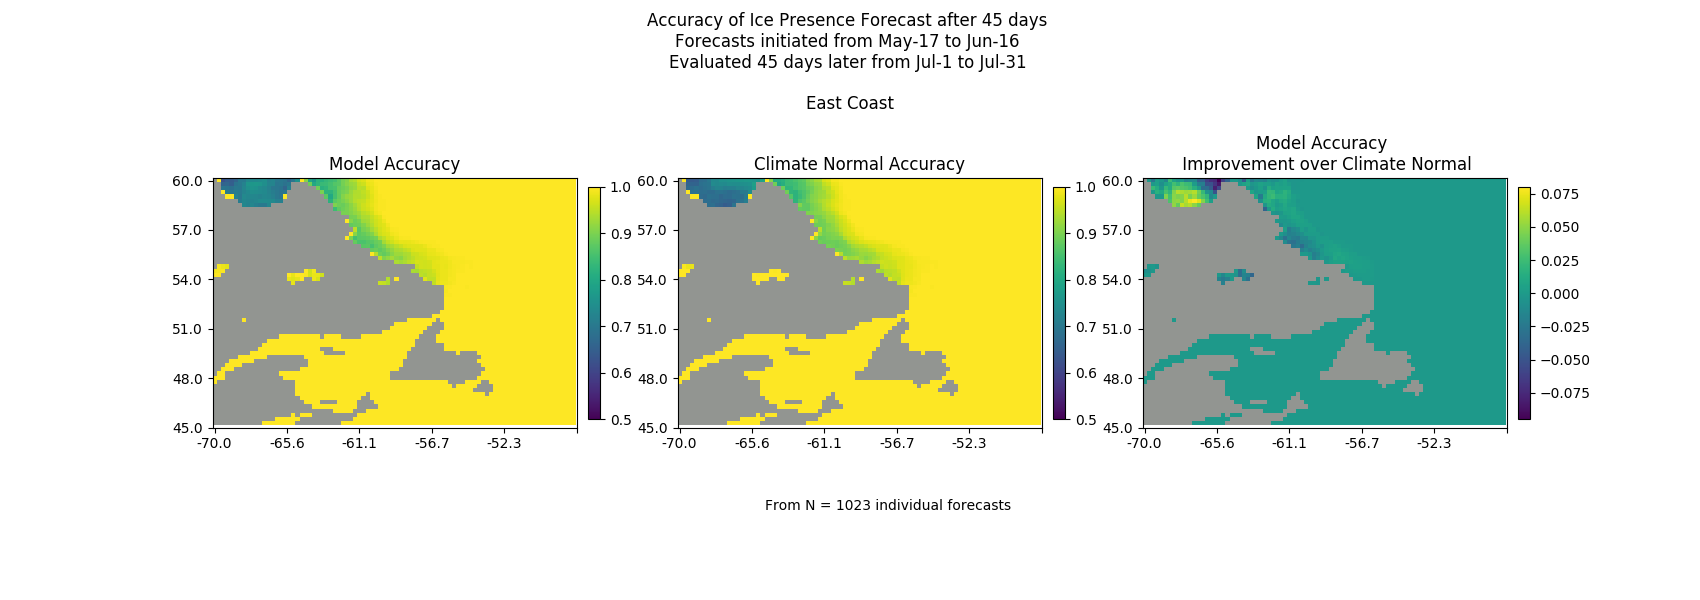
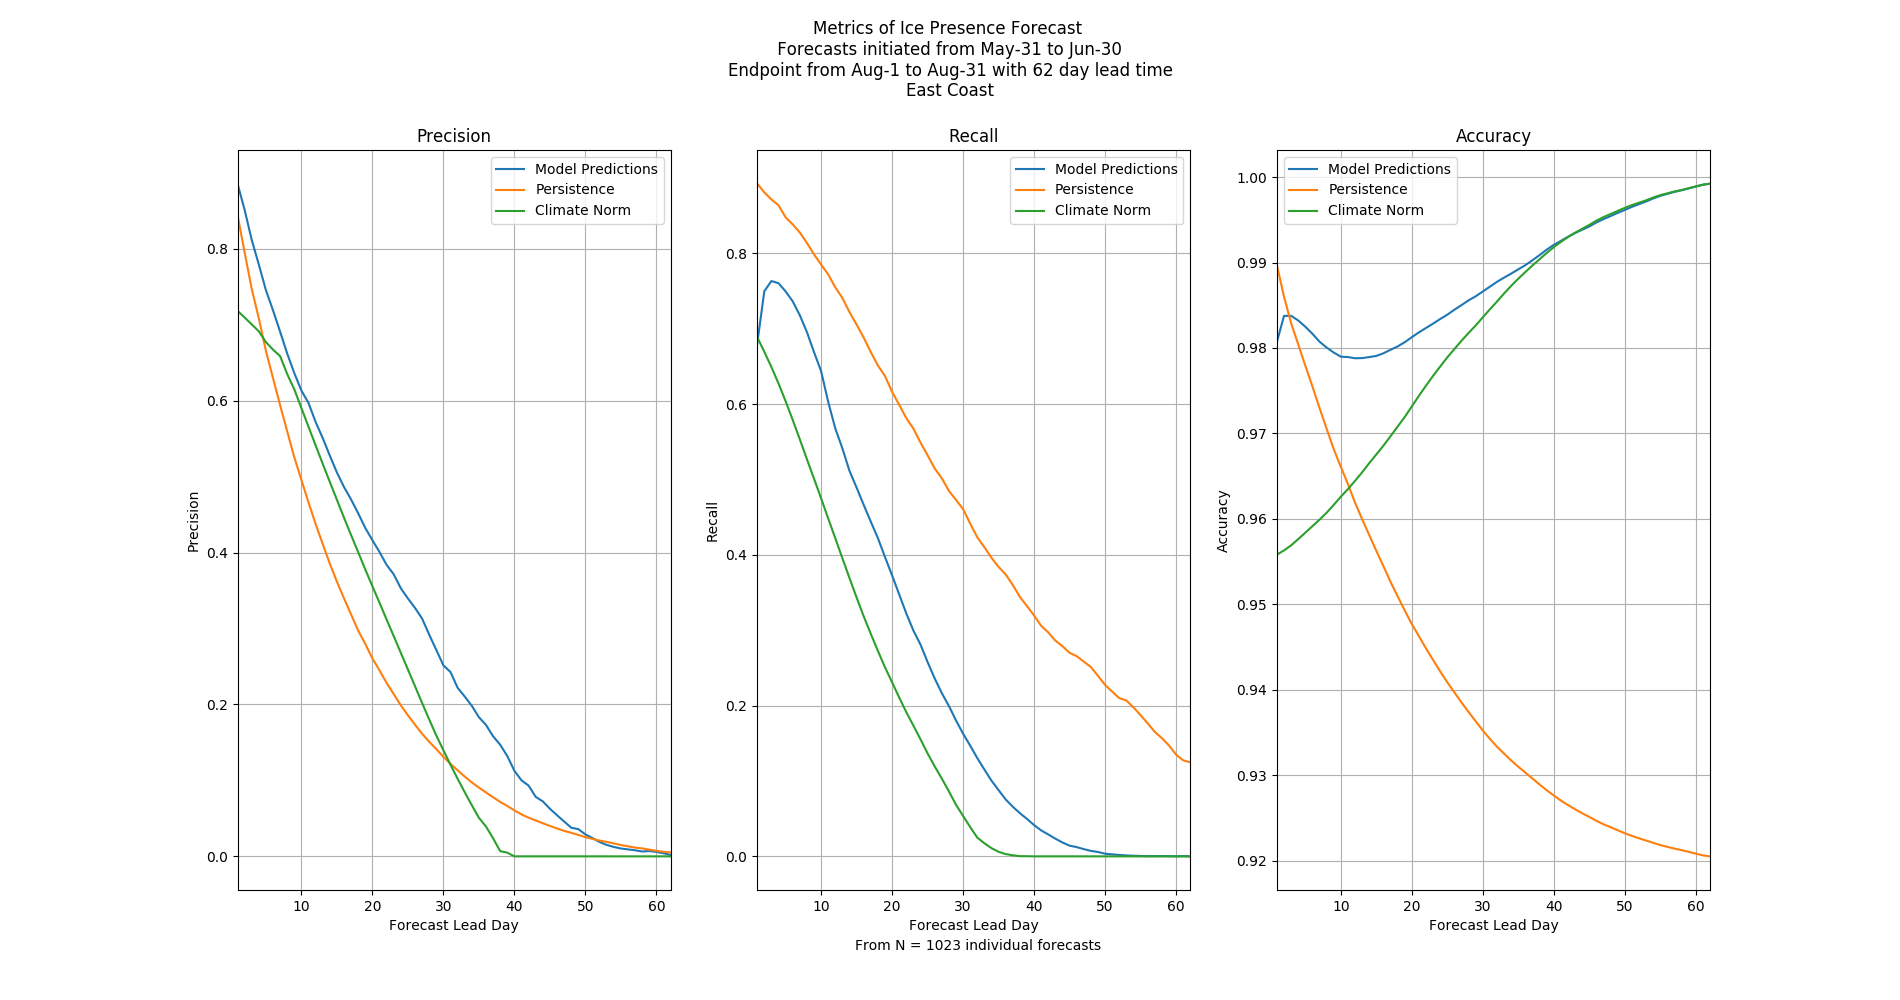
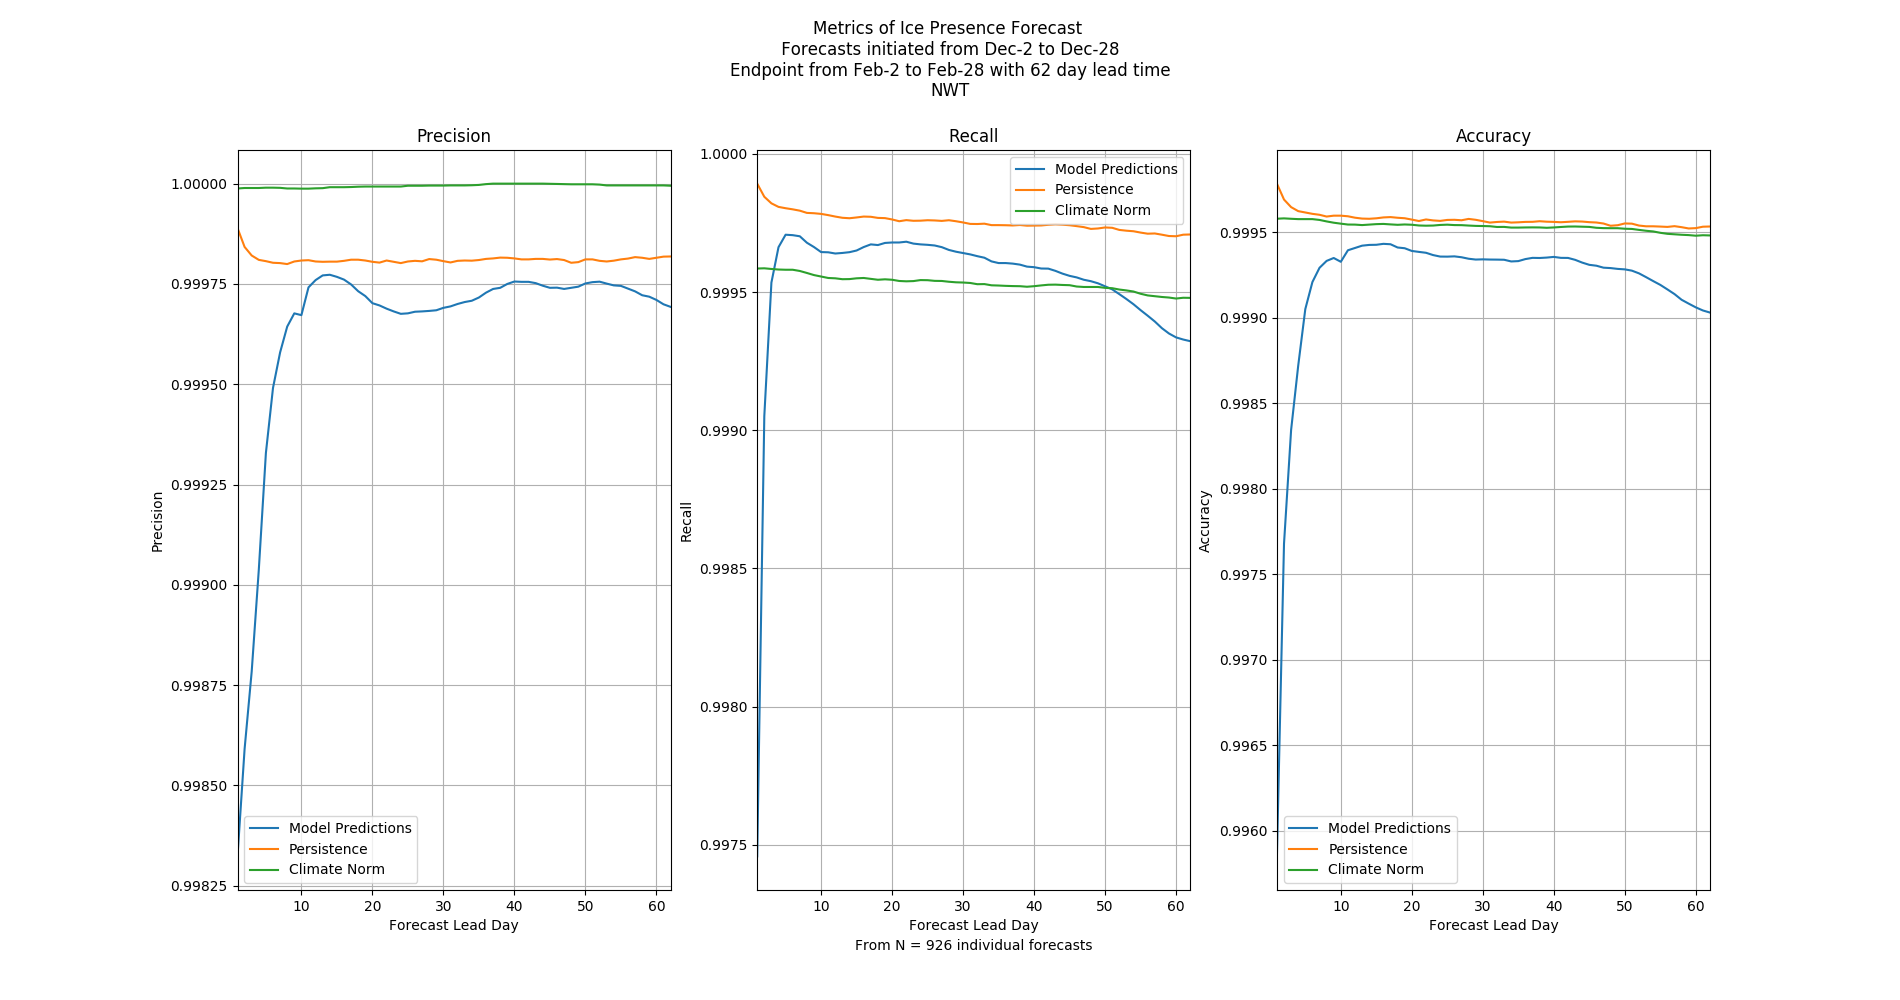
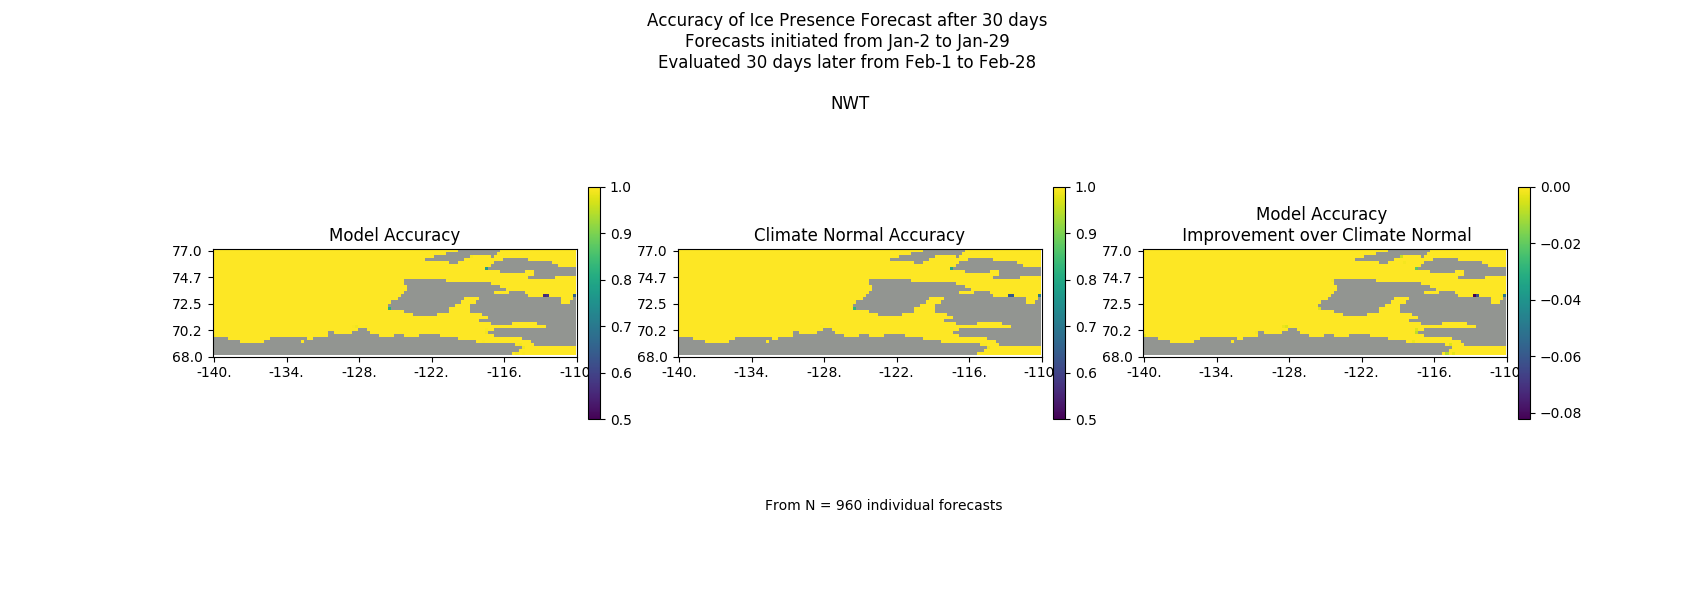
Validation Graphs
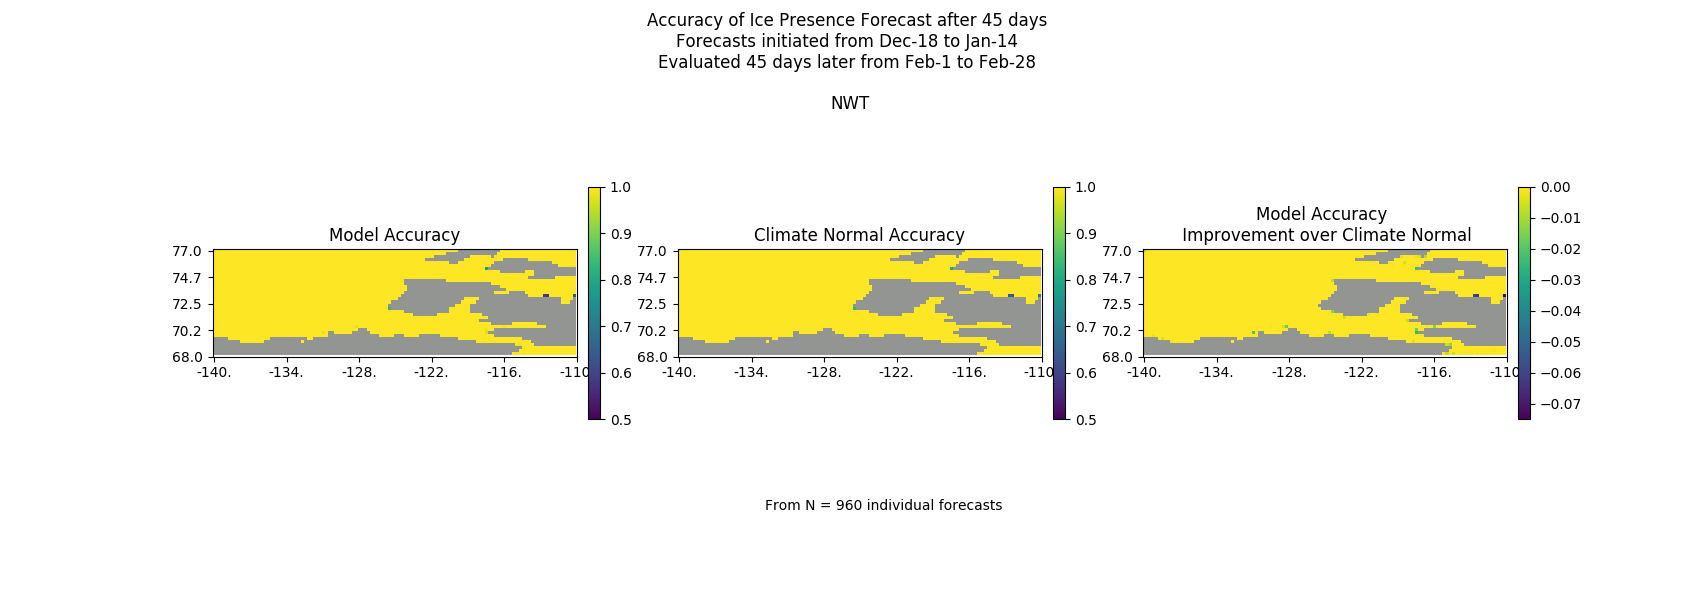
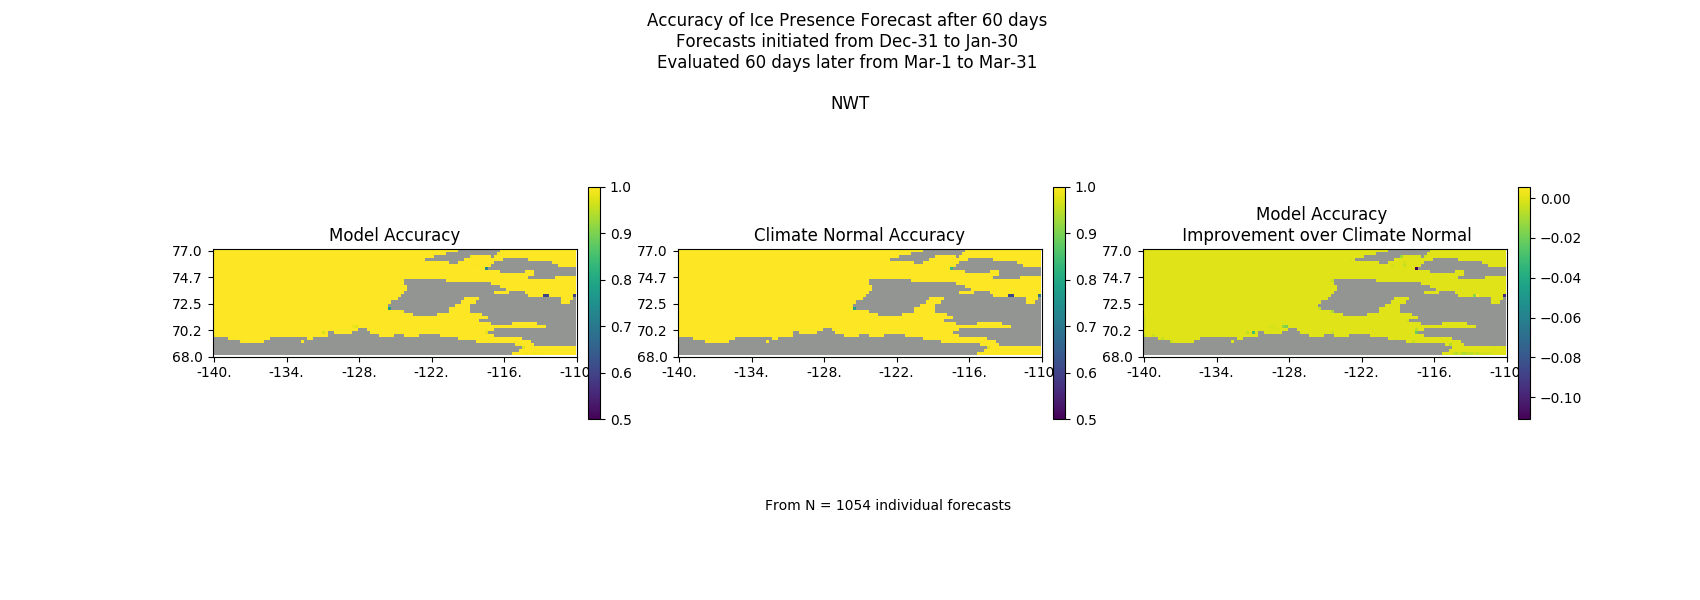
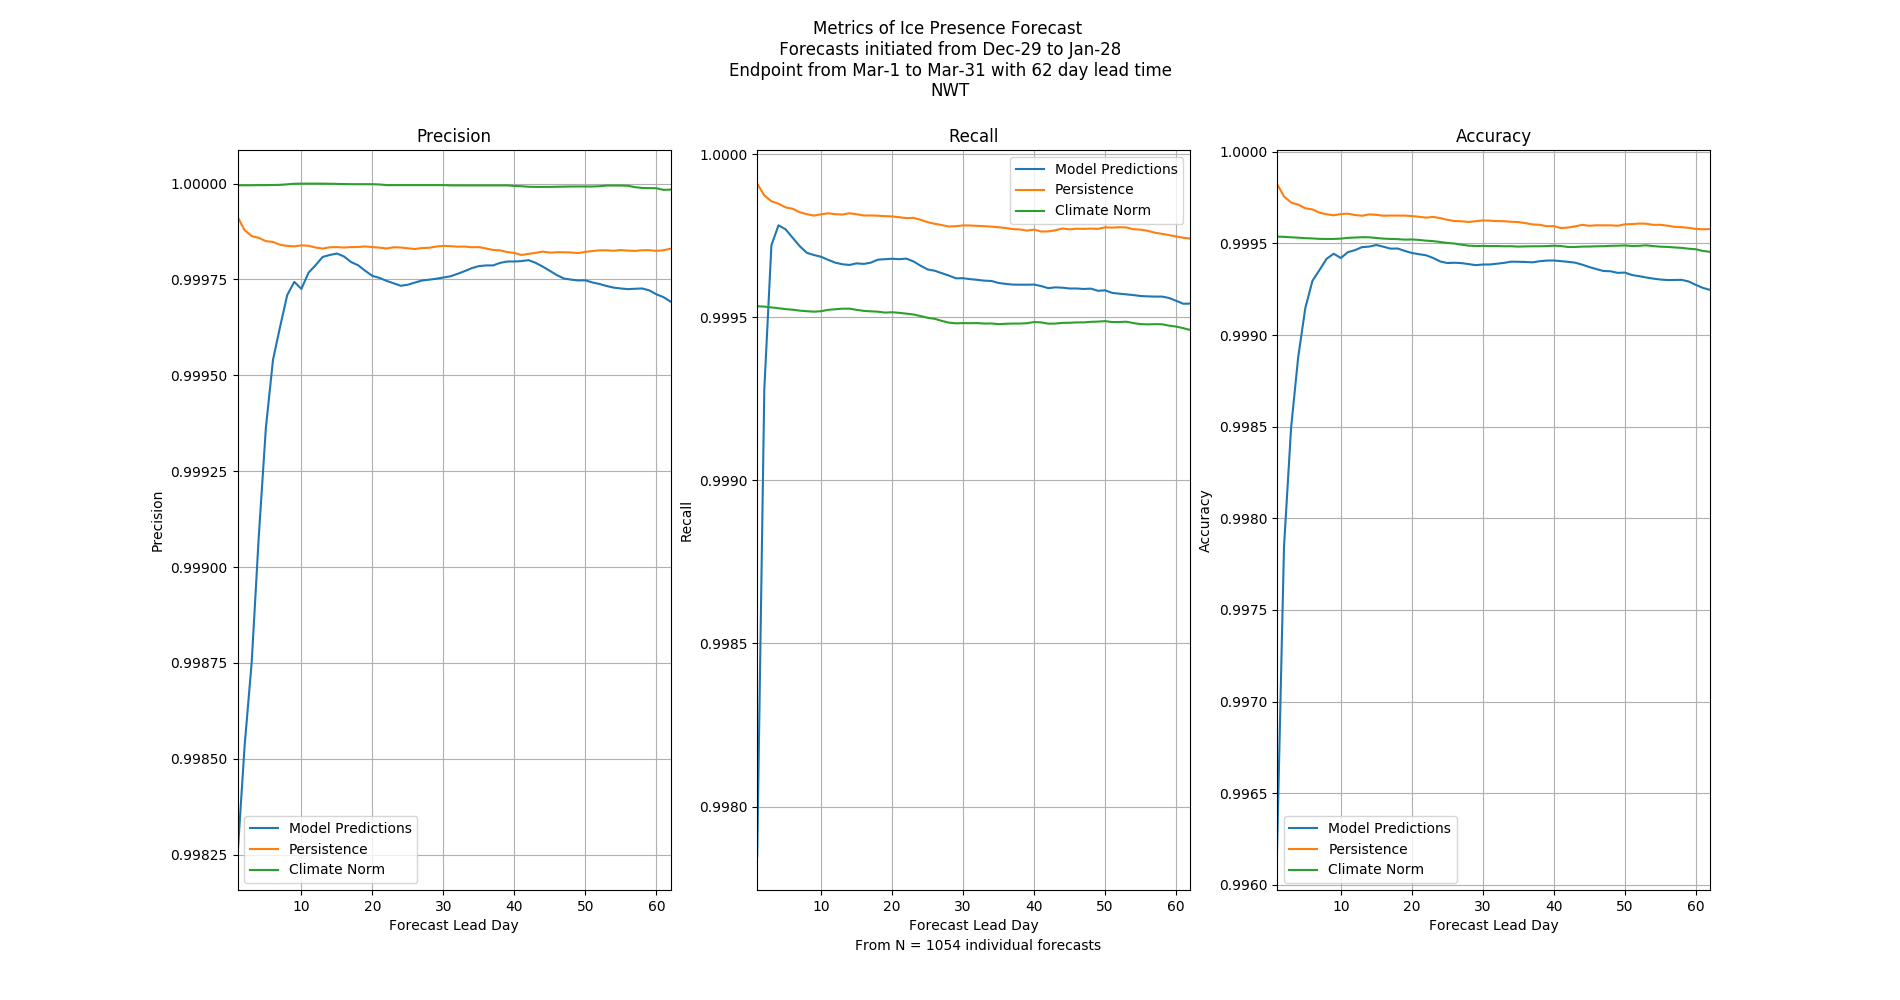
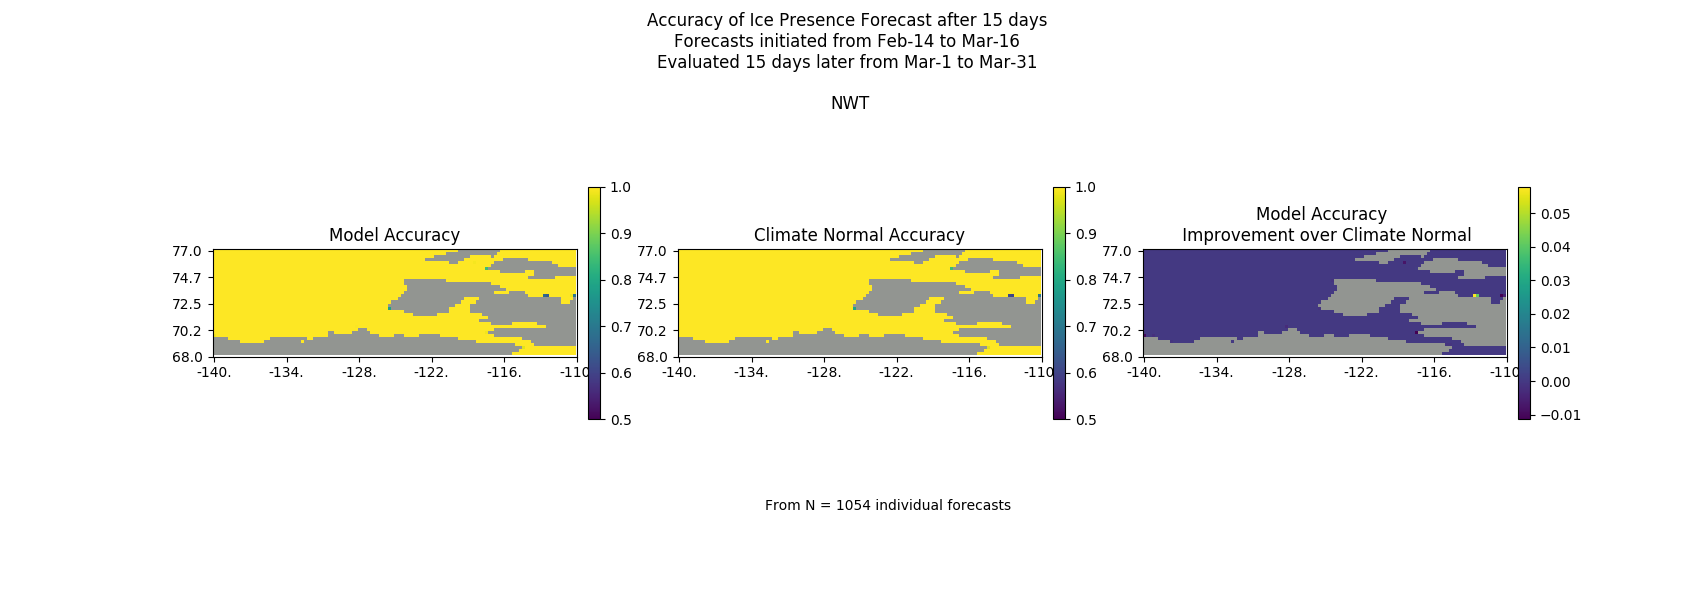
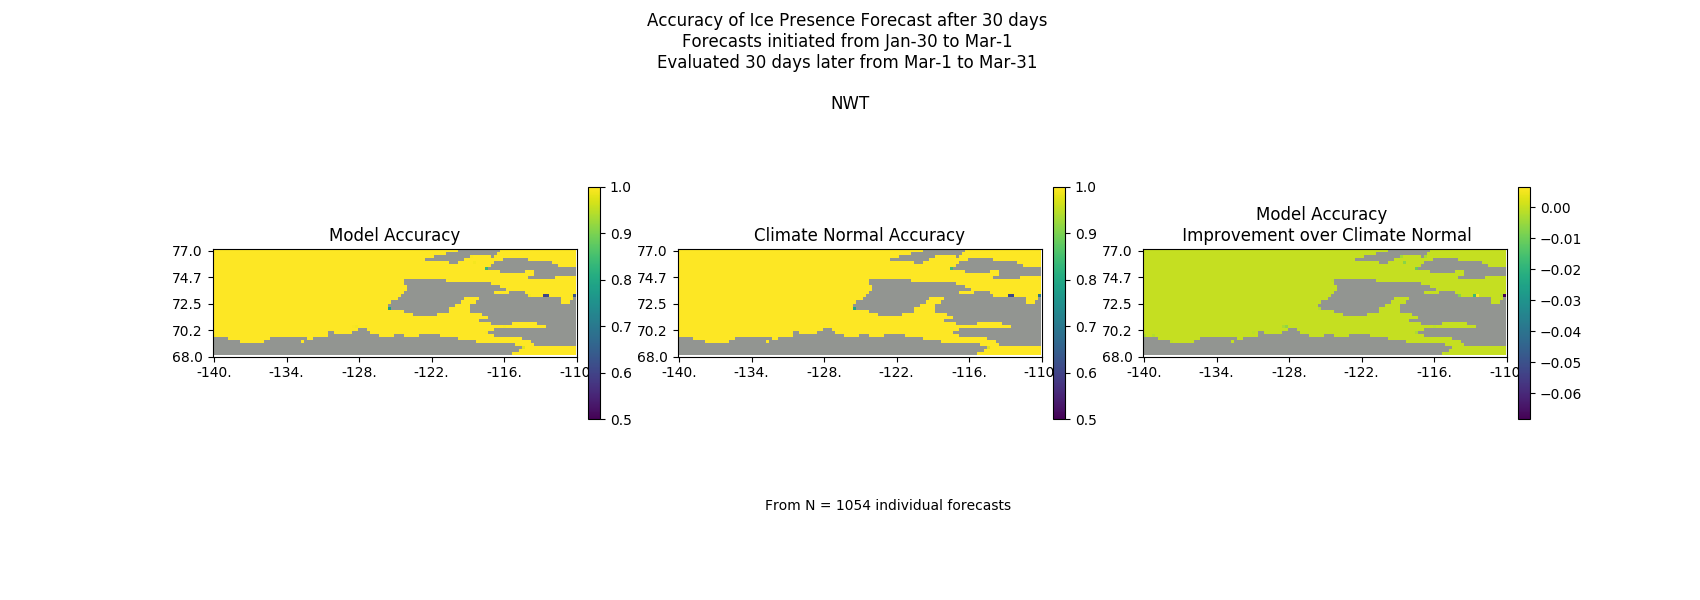
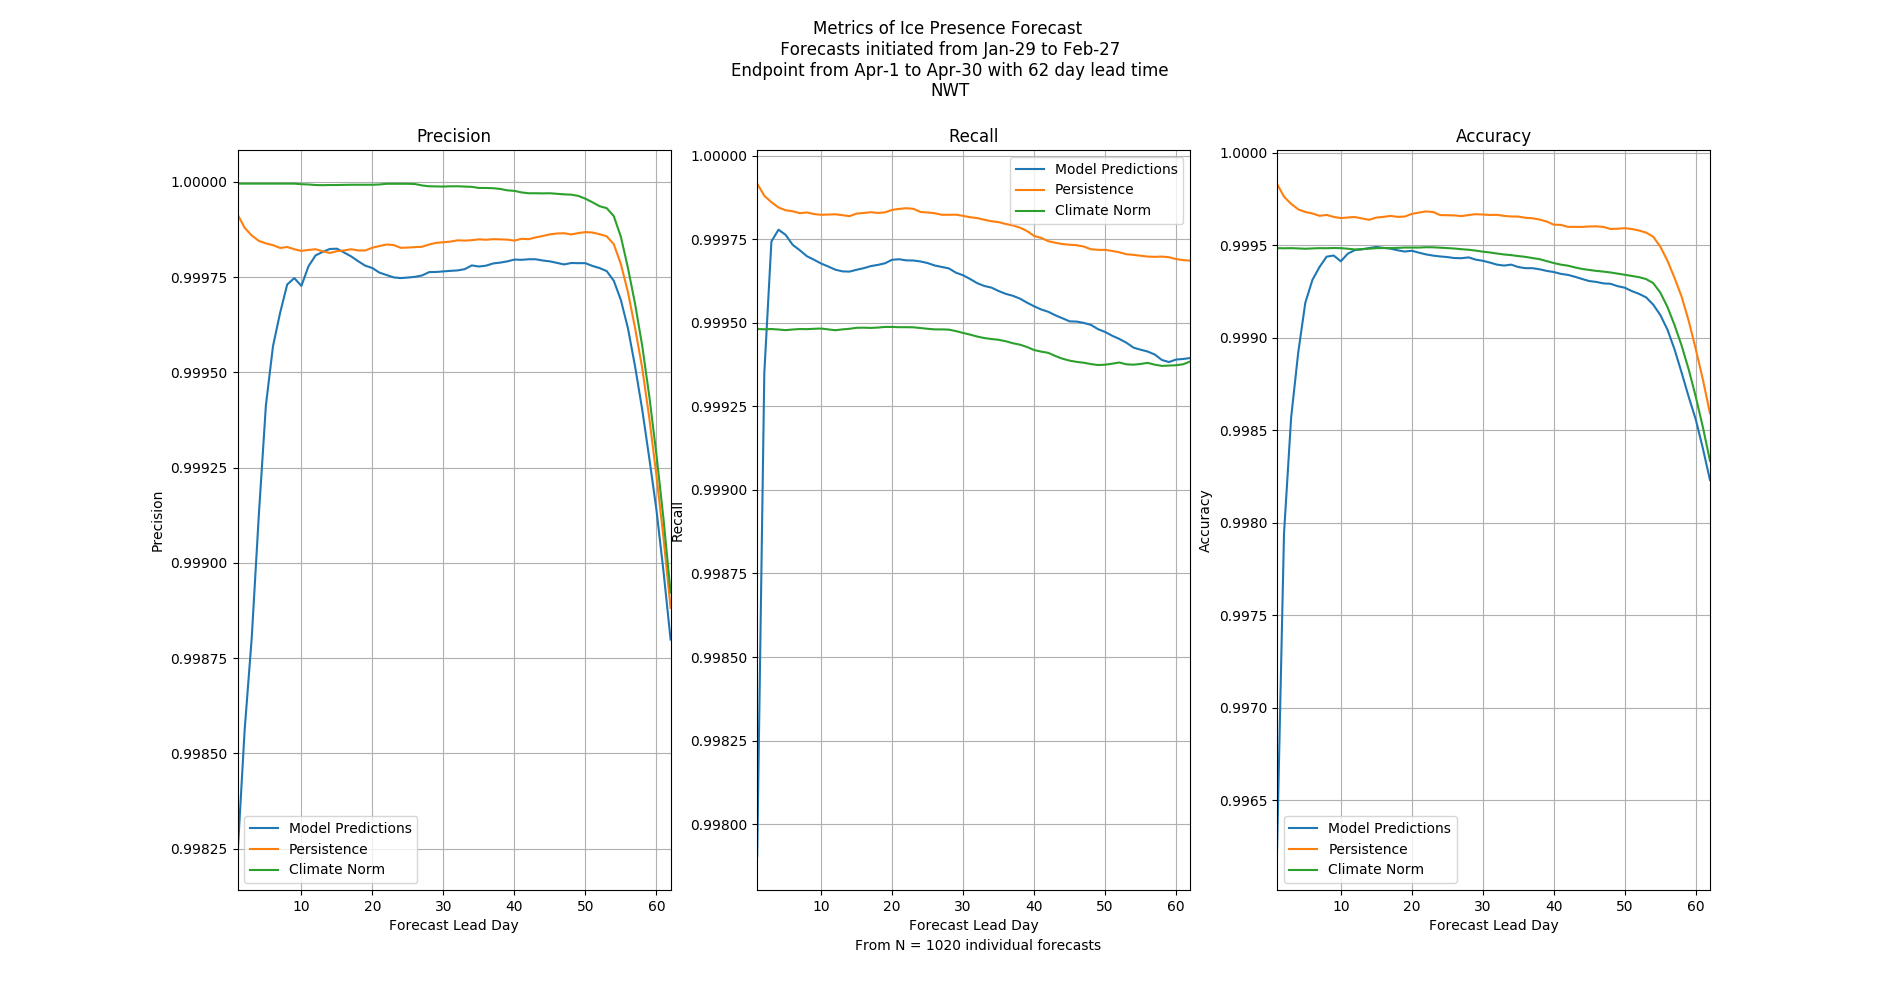
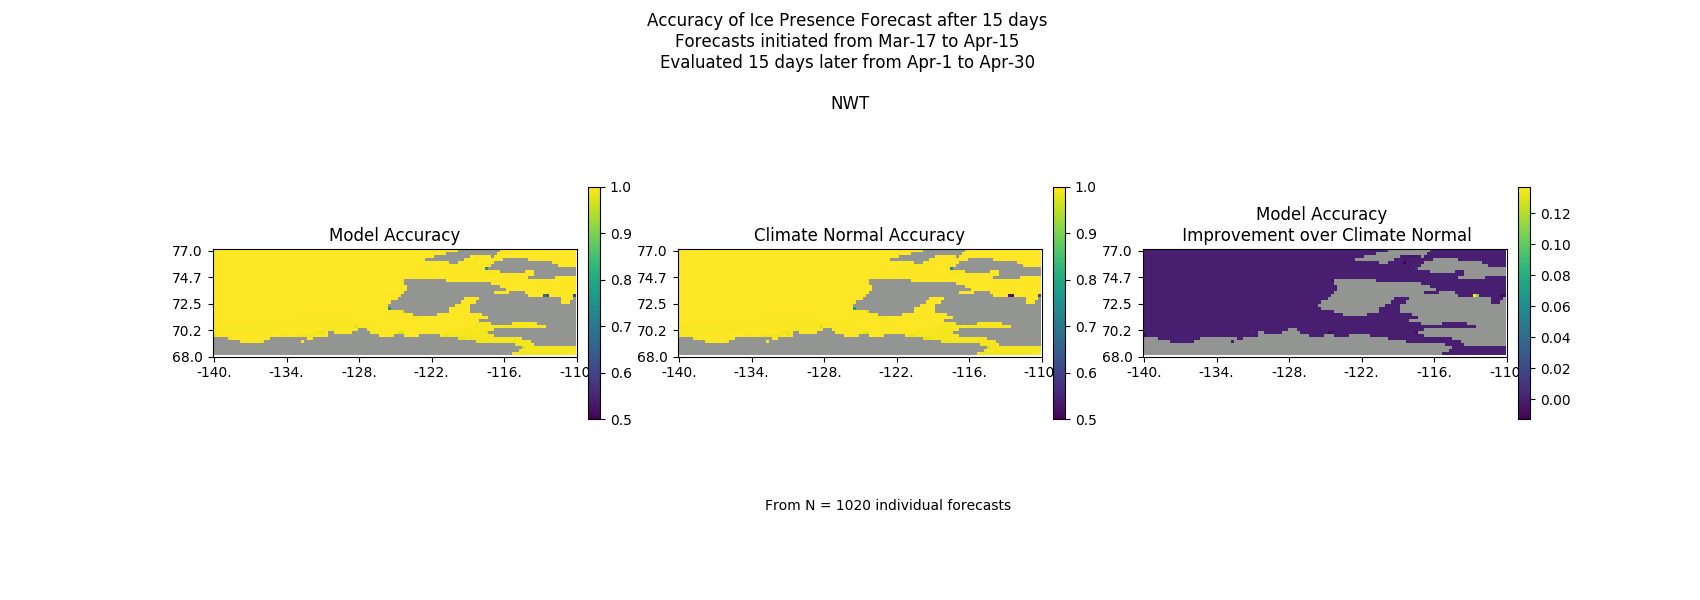
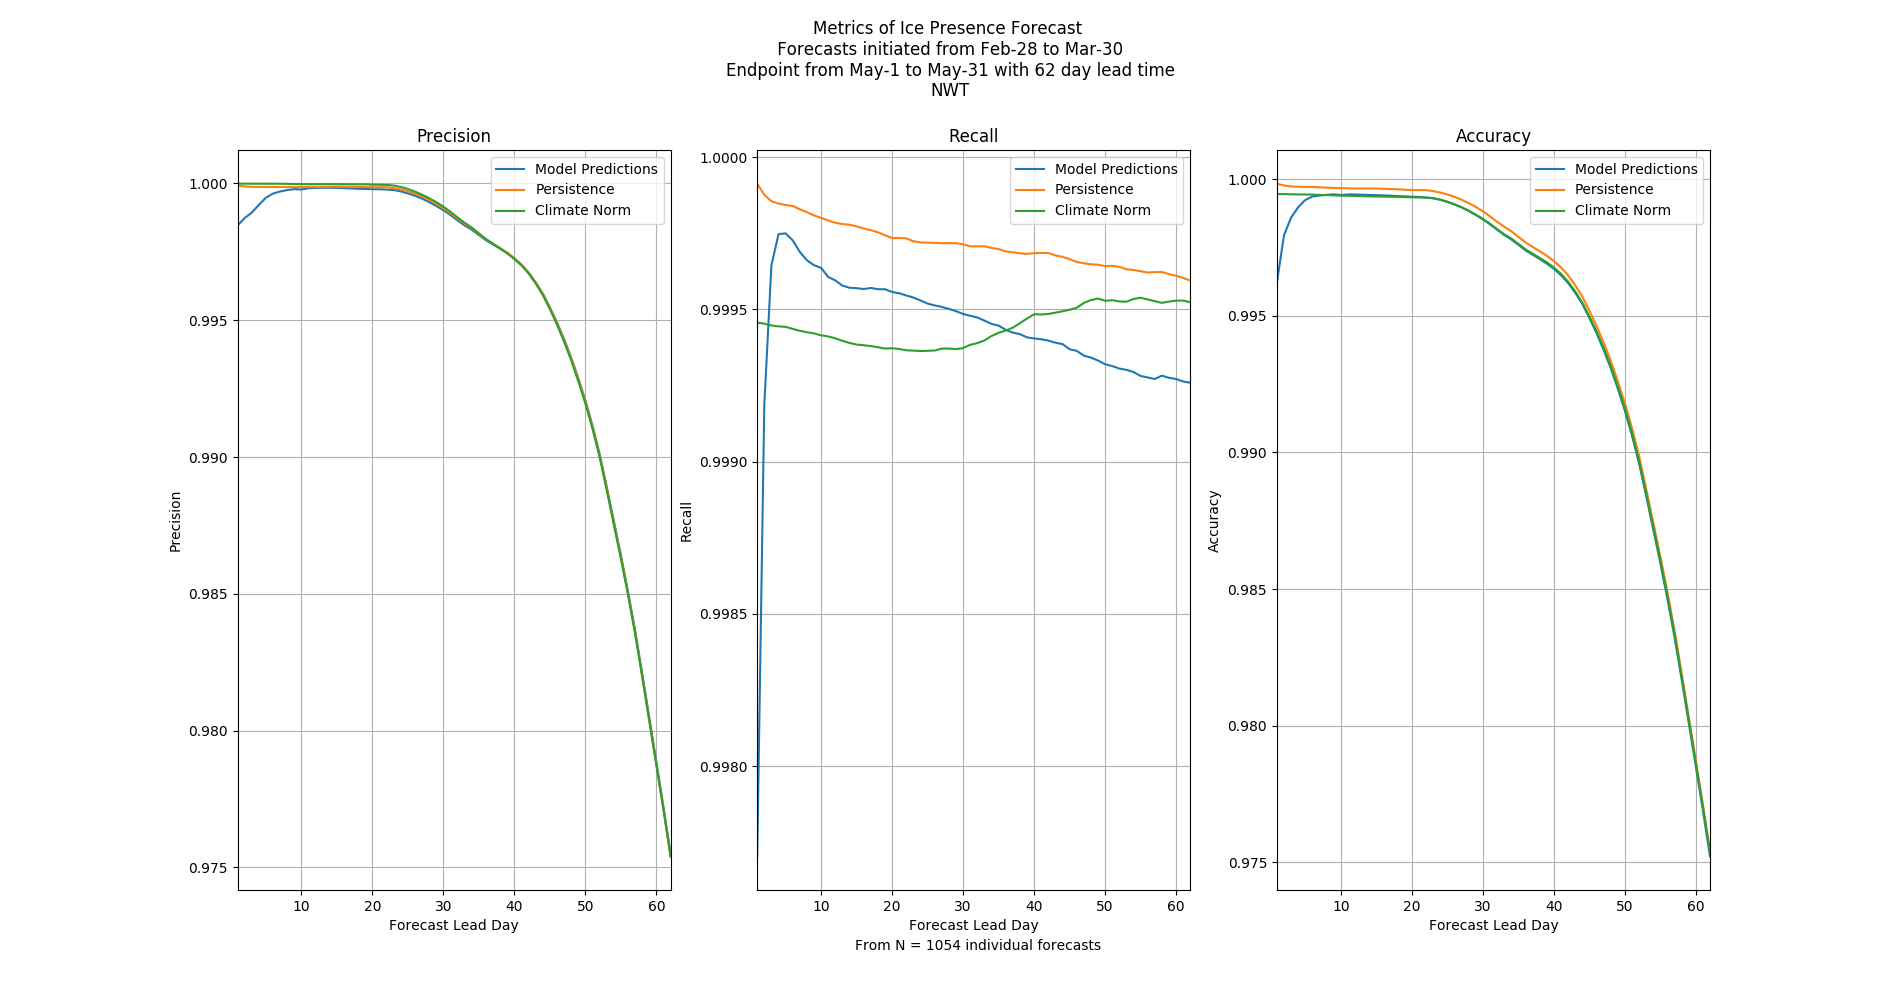
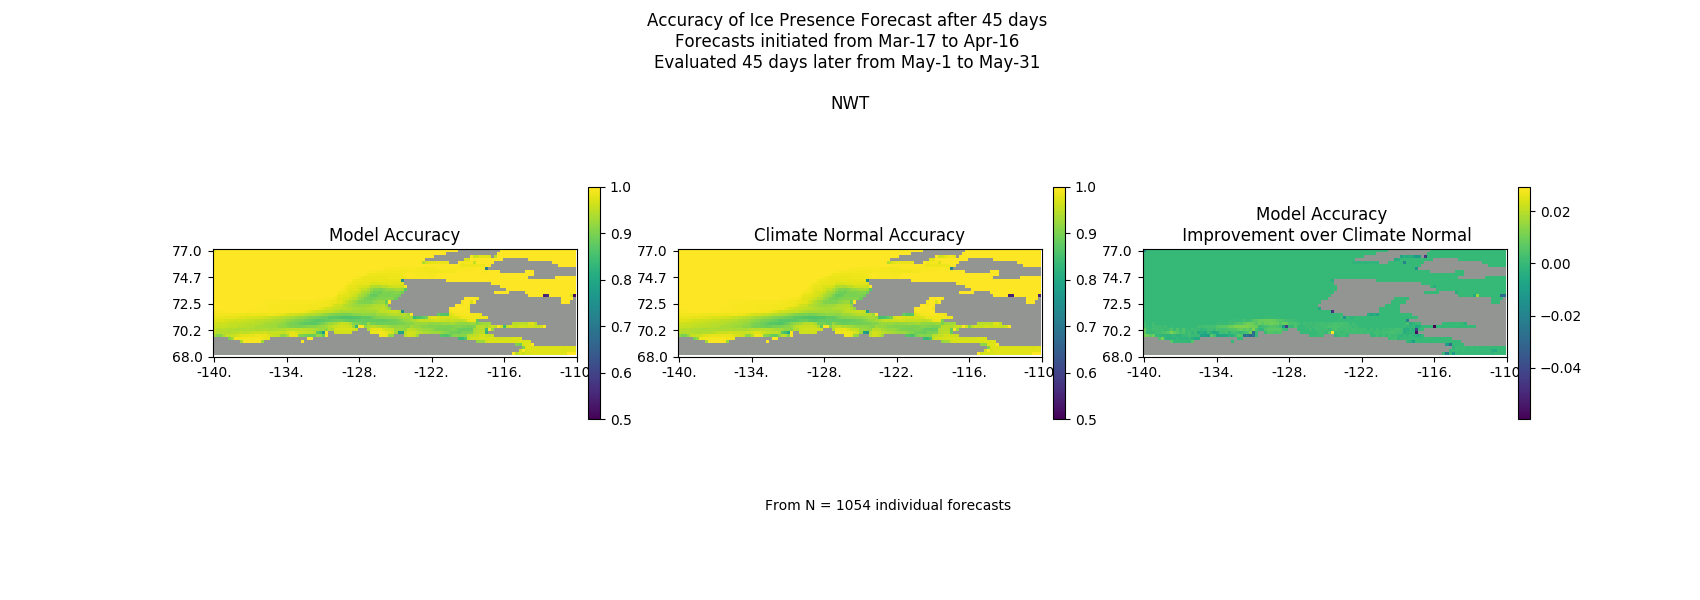
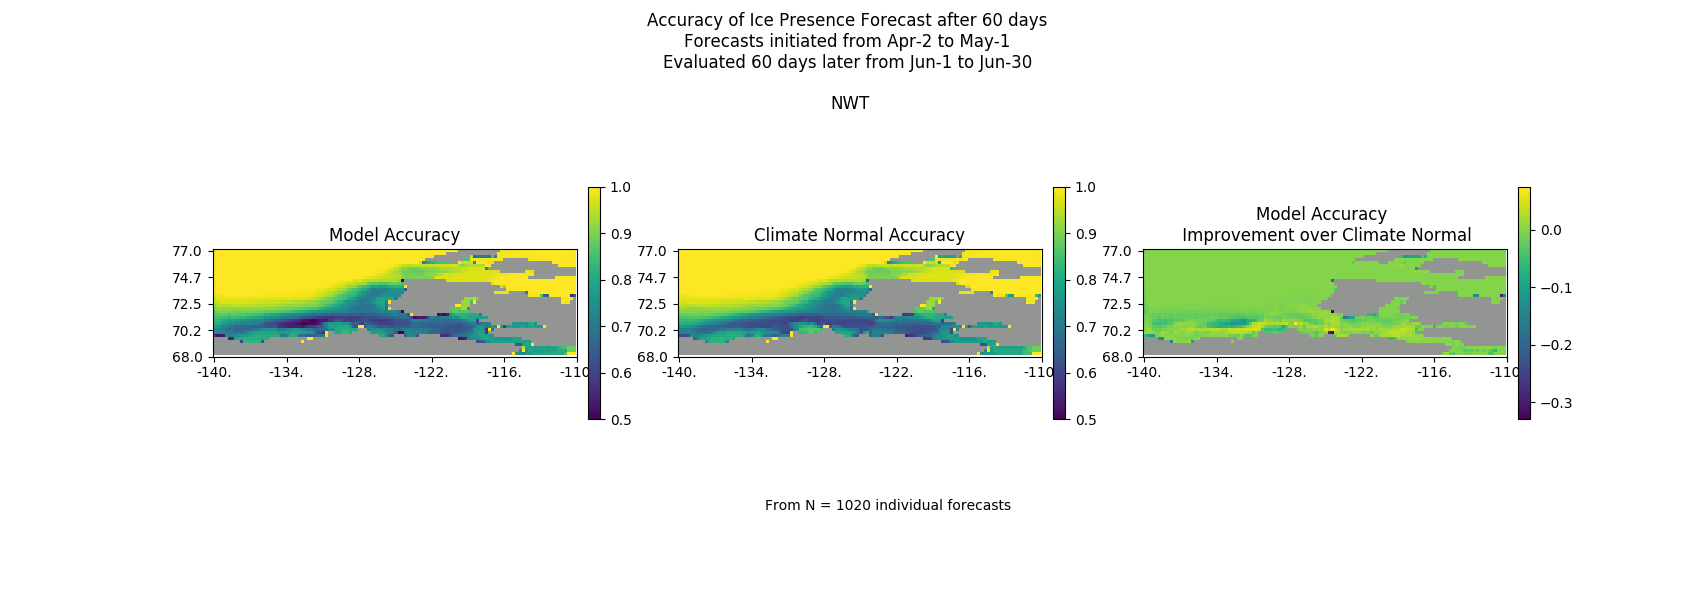
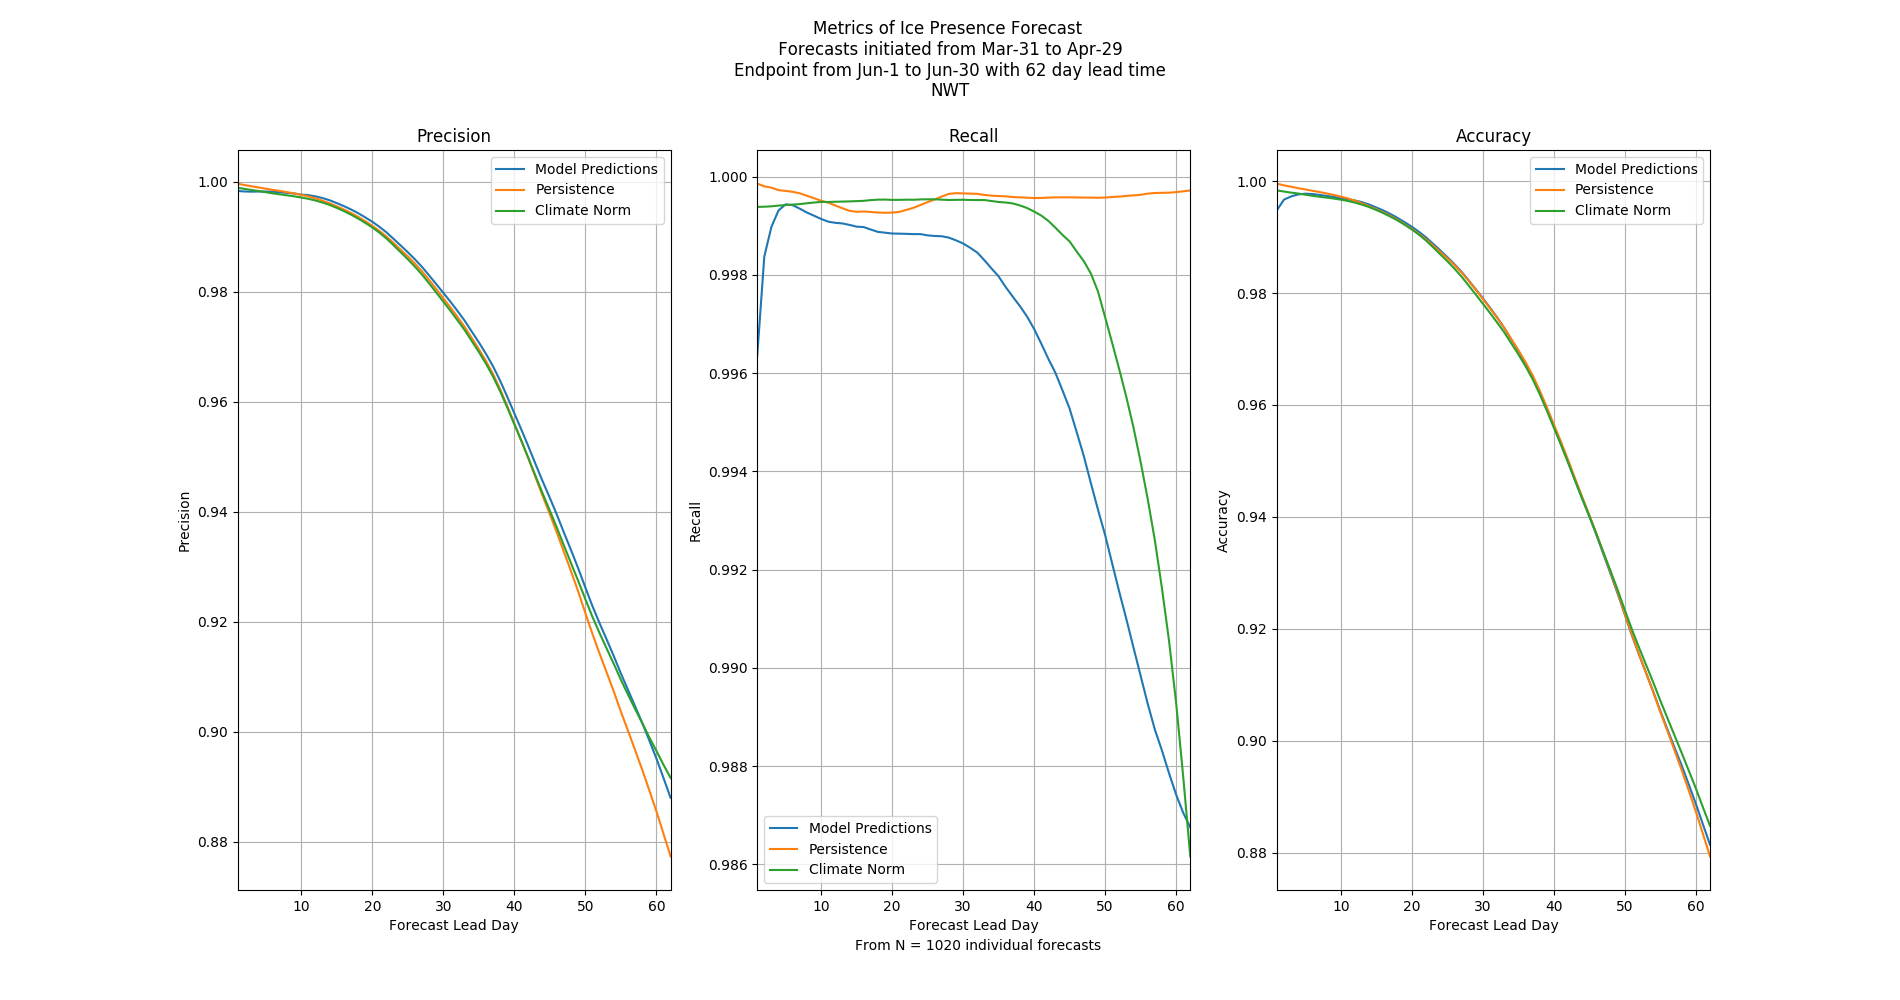
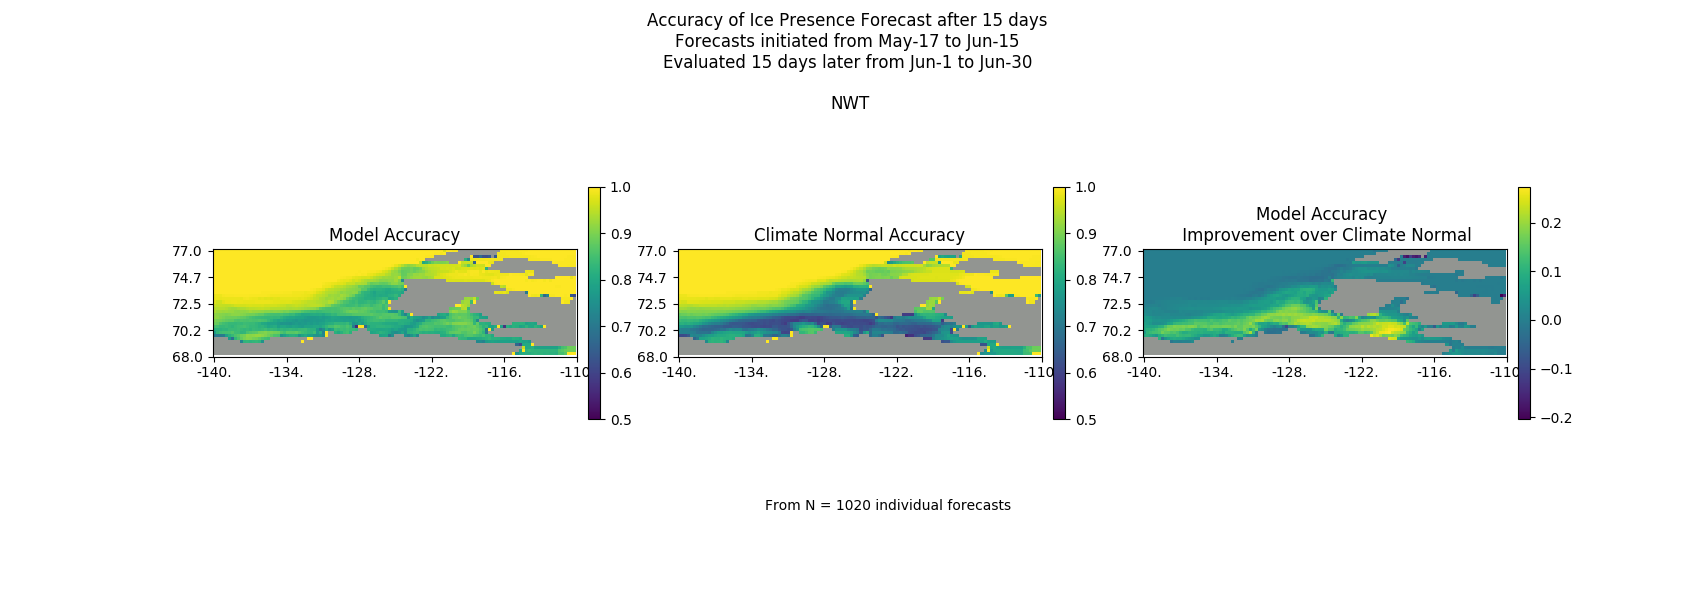
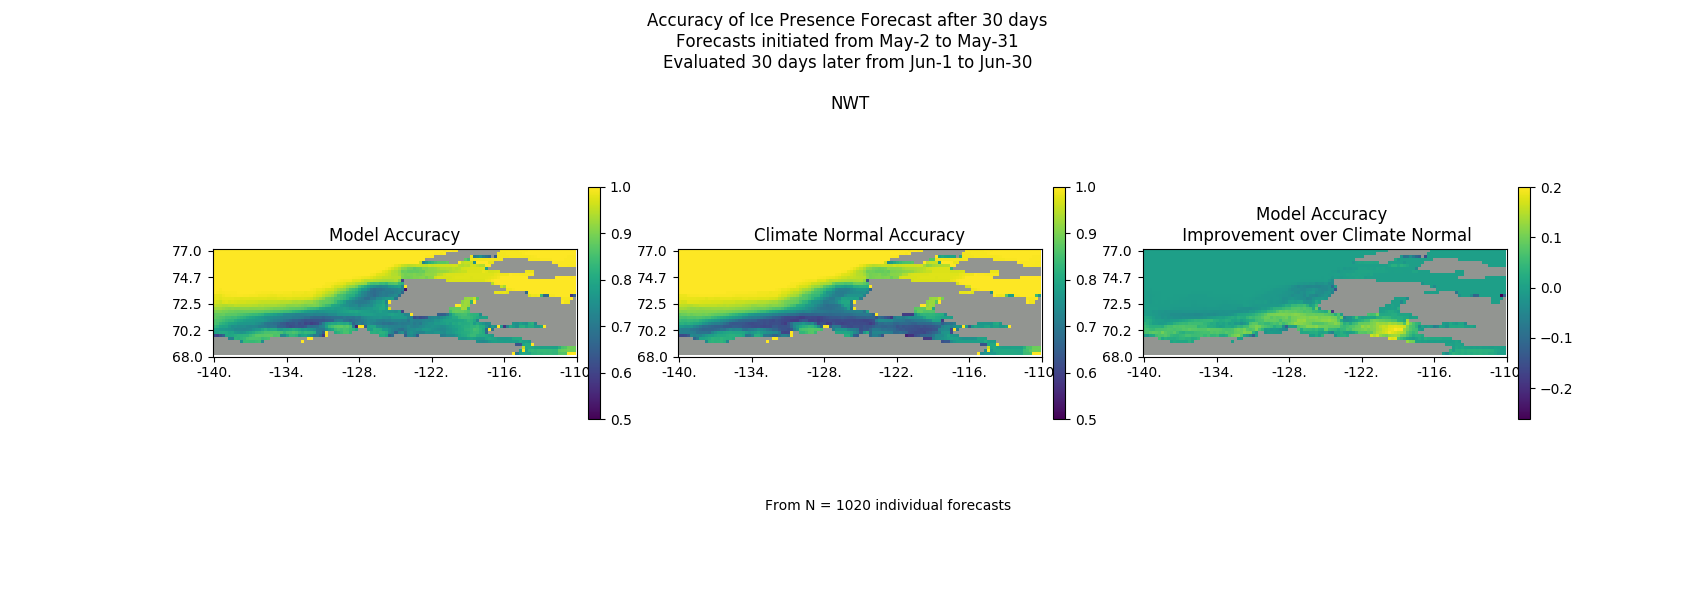
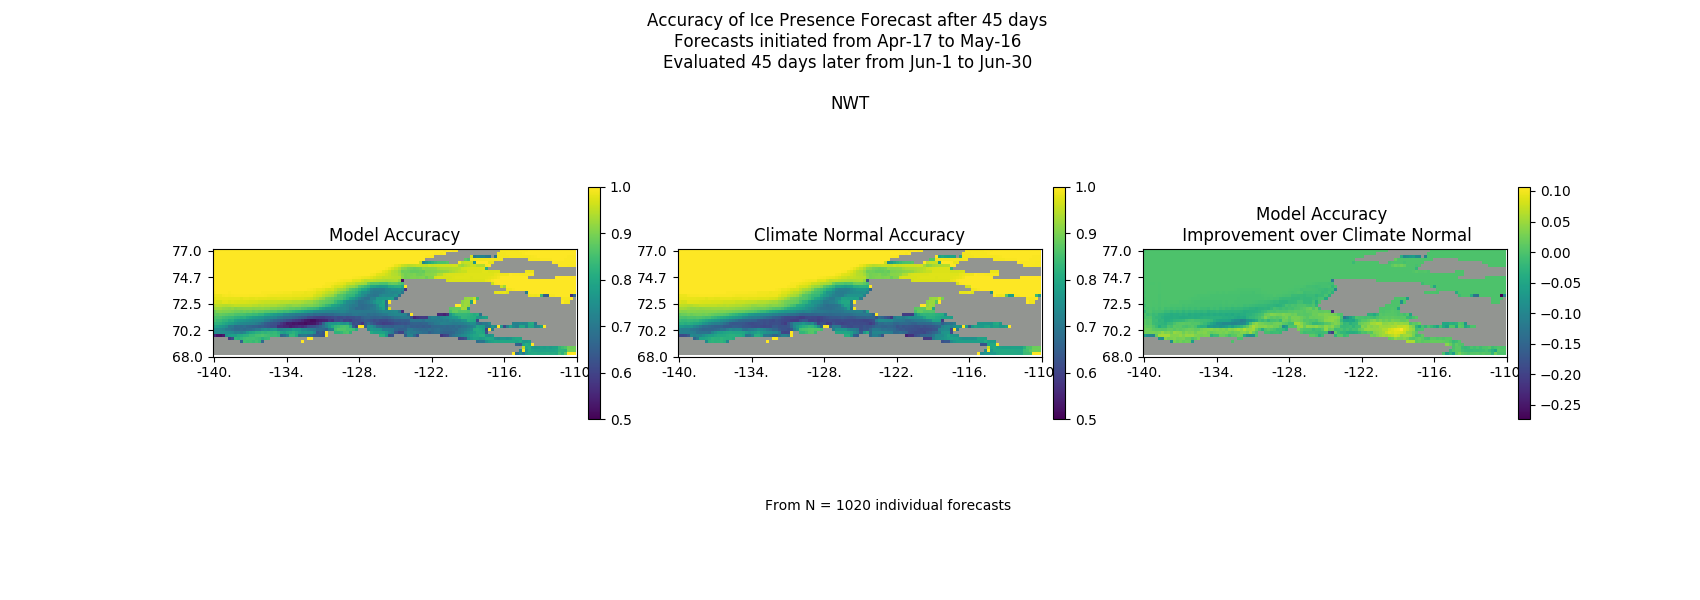
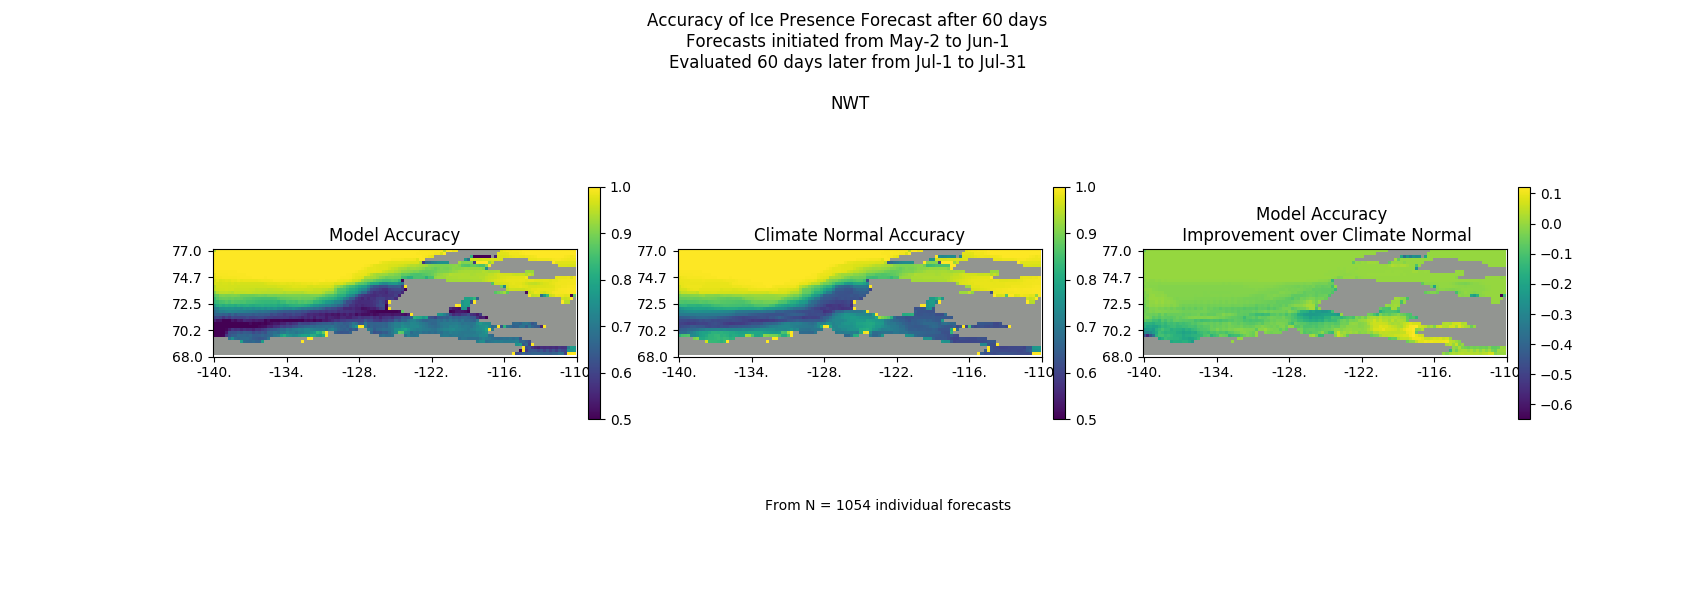
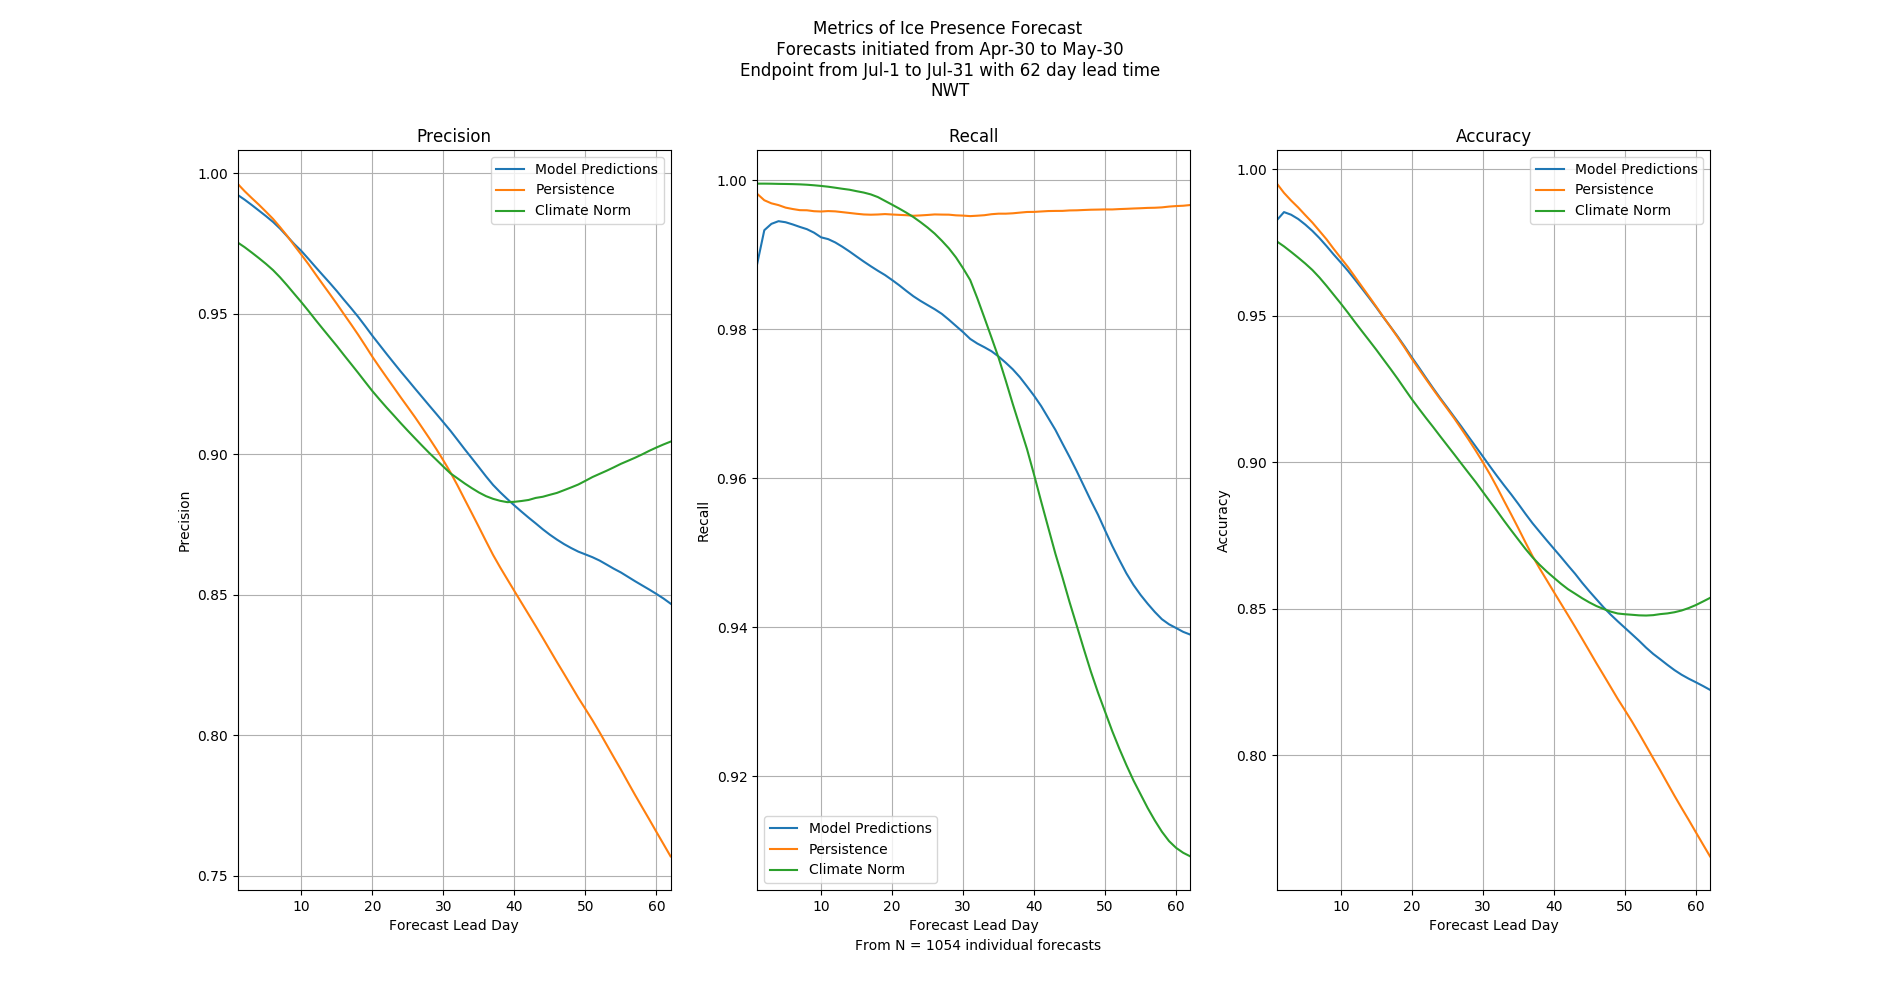
Below are several figures highlighting performance of trained AI models. Provided are accuracy maps, demonstrating pixel-wise accuracy for a given period, and plots that summarize accuracy over the length of the forecast.
Accuracy maps compare the model performance to climate normals of the area. Accuracy plots display the AI model's precision, recall, and binary accuracy over the duration of the forecast. Graphs are plotted for several months during the break-up season of the region.


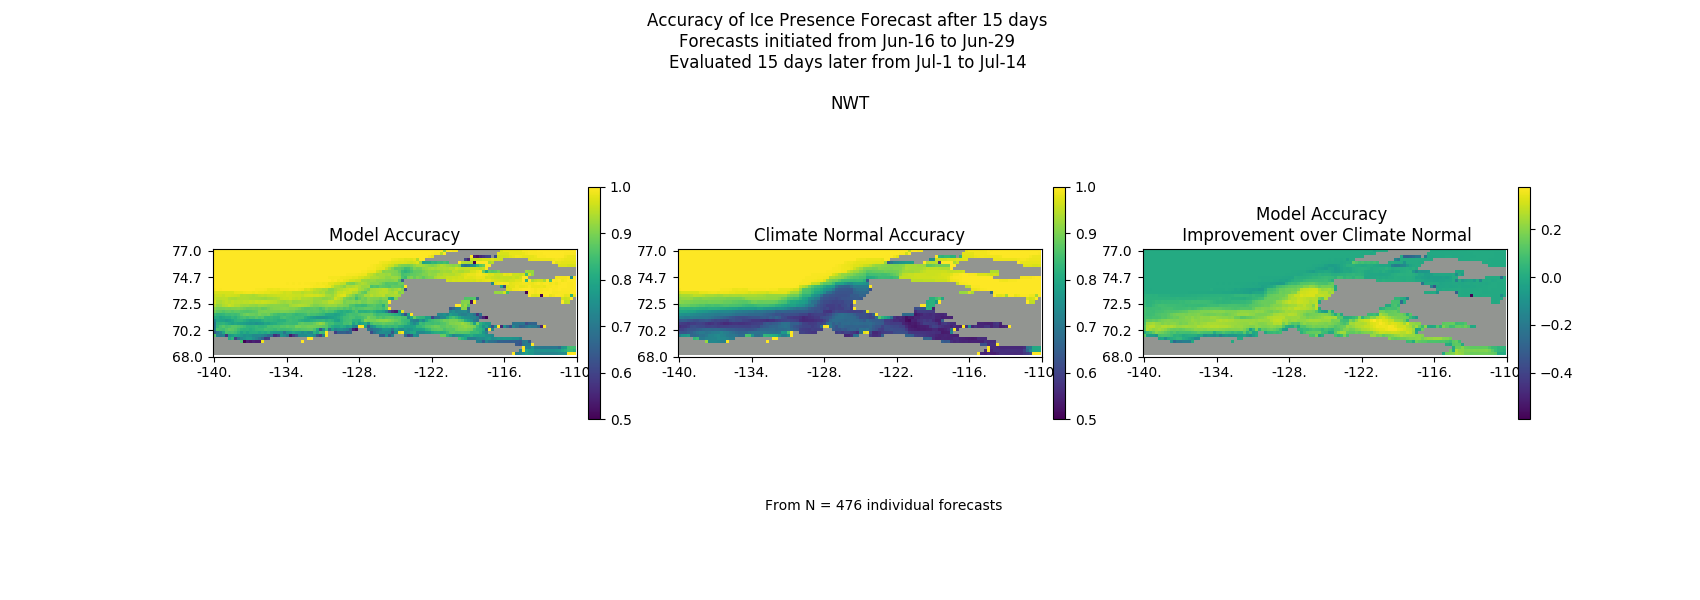
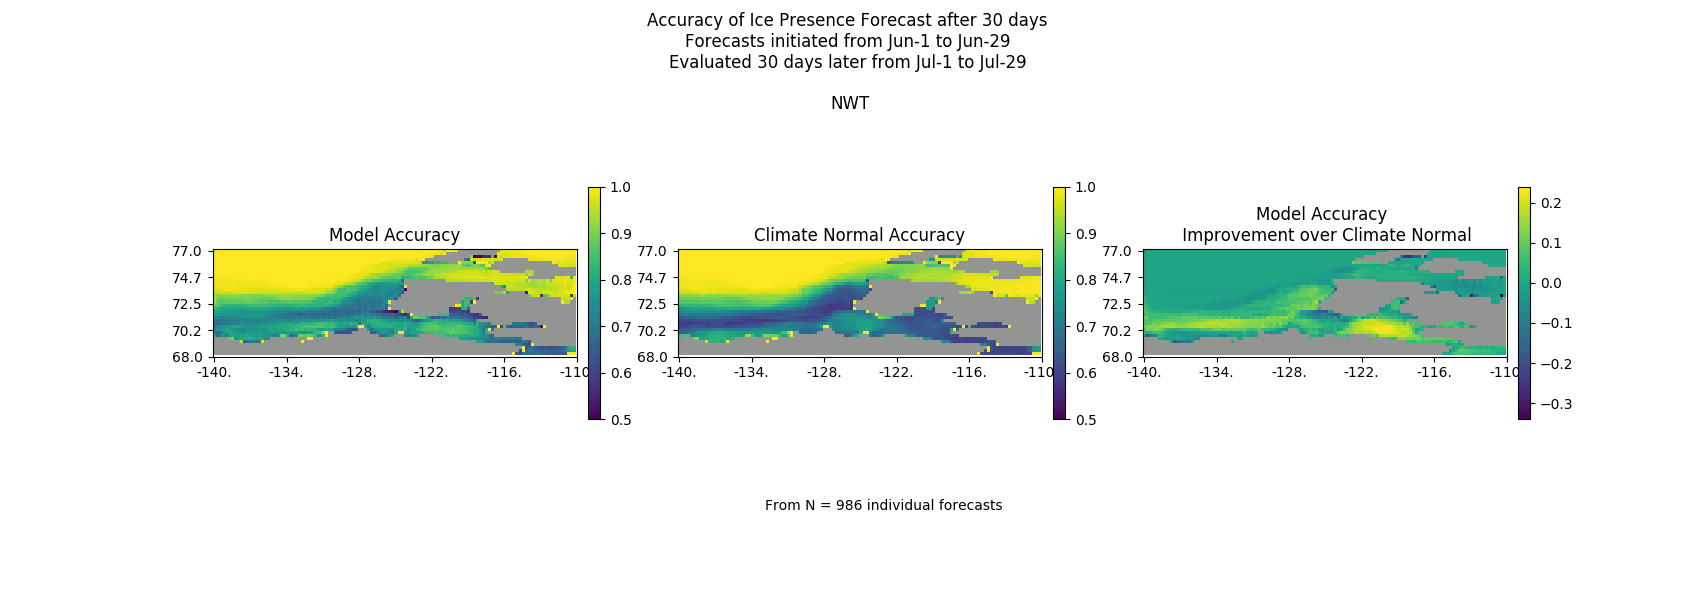
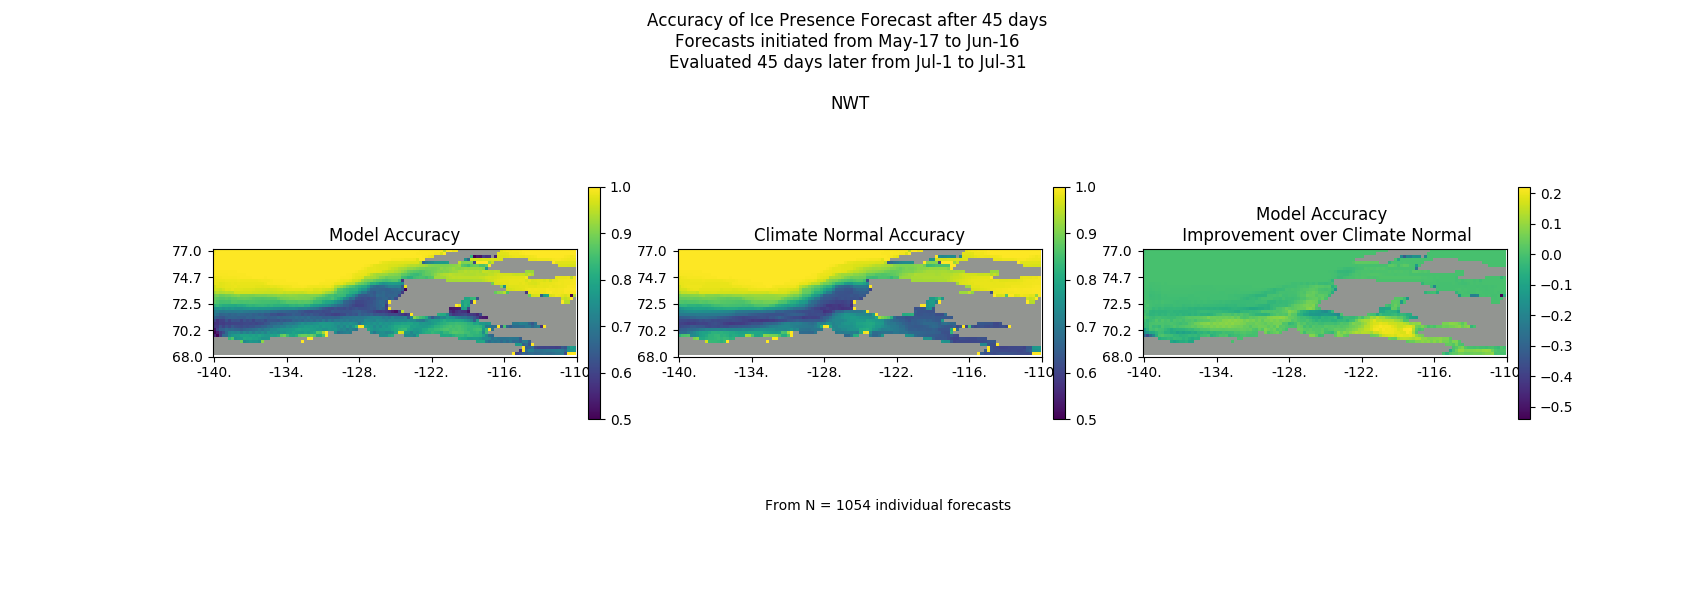
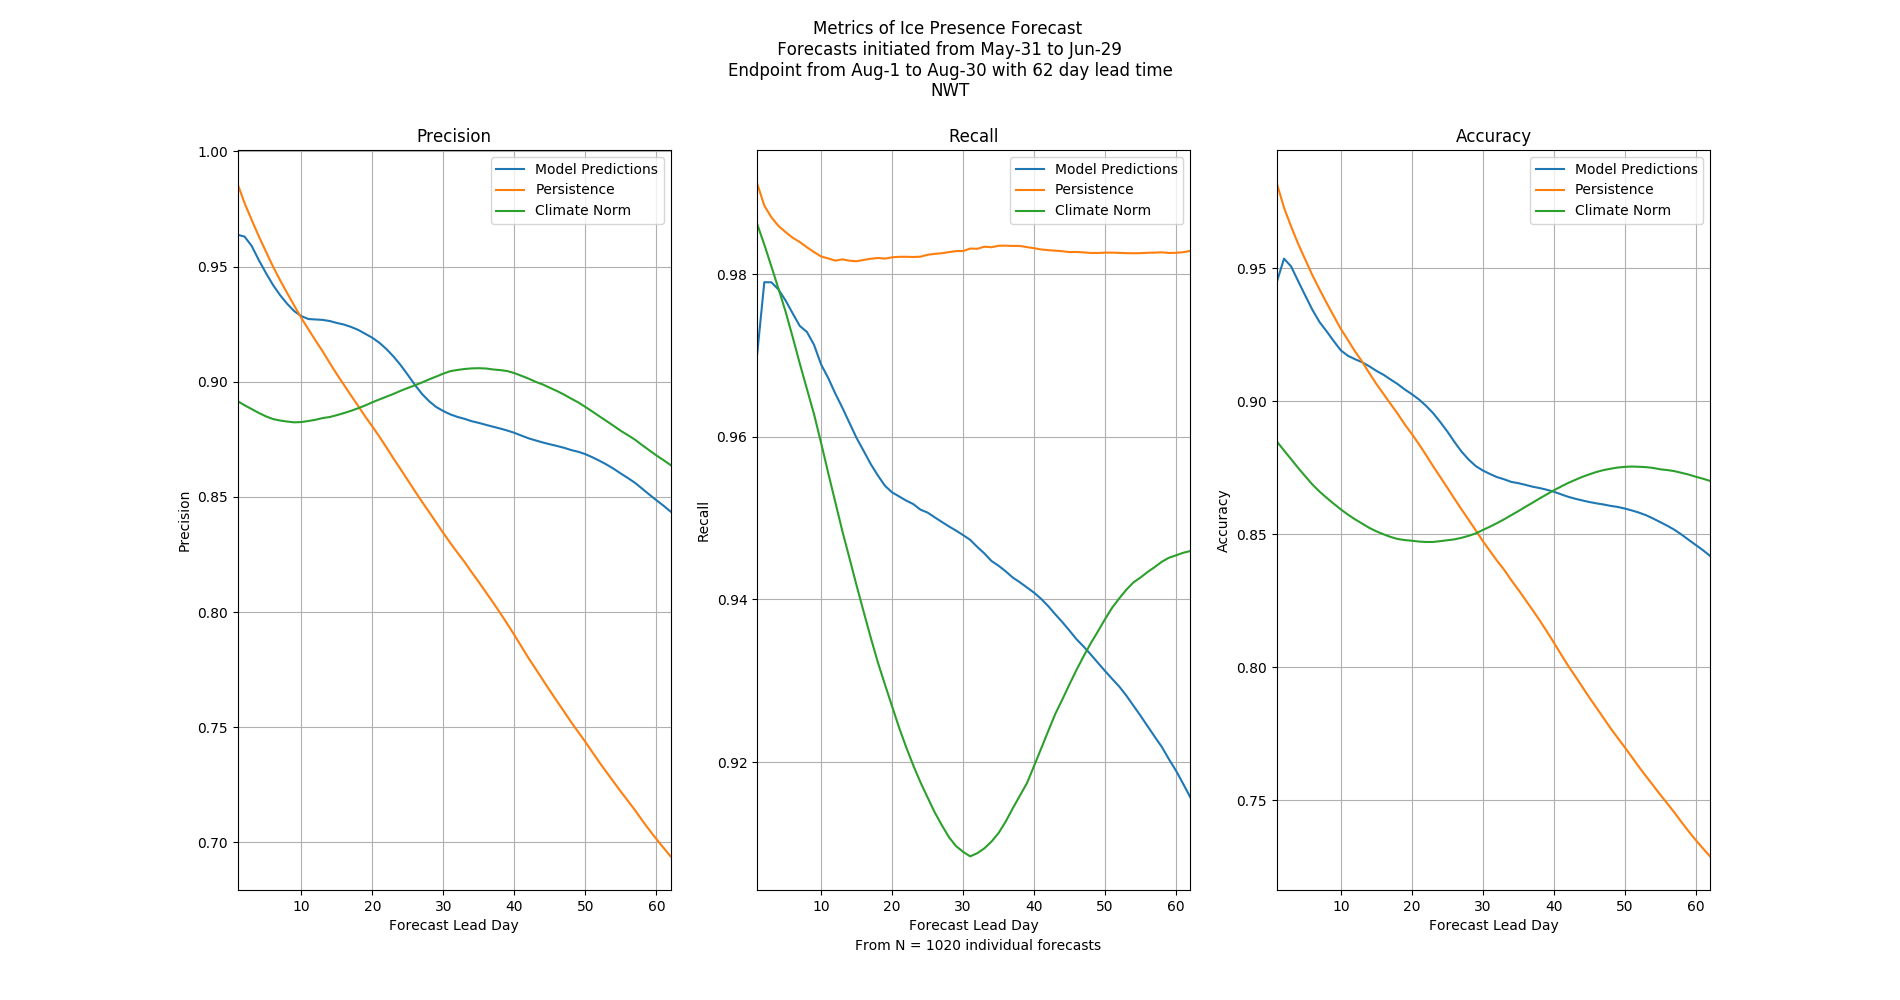
Ice Presence Forecasts
Below is a gif file animating the forecasted movement of ice in the Northwest Territories for the next 62 days.
Latest Upload:
Forecasted For:
All products, including PNG's and GeoTIFF's are available for download via the button below.
Validation Graphs
Below are several figures highlighting performance of trained AI models. Provided are accuracy maps, demonstrating pixel-wise accuracy for a given period, and plots that summarize accuracy over the length of the forecast.Accuracy maps compare the model performance to climate normals of the area. Accuracy plots display the AI model's precision, recall, and binary accuracy over the duration of the forecast. Graphs are plotted for several months during the break-up season of the region.


Contact
Project Supervisors
- Philippe Lamontagne - Research Council Officer at the NRC
- Richard Burcher - Software Specialist at the NRC
Developers
- Michael Nasello (University of Waterloo)
- Matthew King (Memorial University)
- William Zou (University of Waterloo)
For more information regarding the project, please contact Philippe.Lamontagne at nrc-cnrc.gc.ca.